Acid-Base and Oxygen Status of the Blood
Hydrogen Ion, Carbon Dioxide, and Oxygen
Several components are either derived from these or able to interact with them, e.g. haemoglobin, bicarbonate, carbon monoxide, methaemoglobin, foetal haemoglobin, and 2,3-diphosphoglycerate.
Four diagrams illustrate the relationships between the many quantities related to these components.
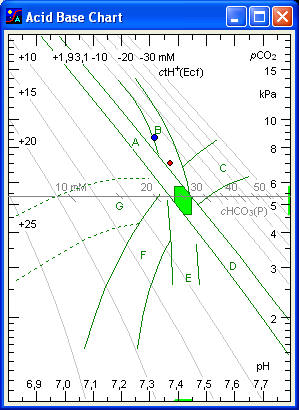
The Acid-Base Chart illustrates the Acid-Base Status of the blood. The three key quantities are: pH, pCO2 and ctH+Ecf (extracellular titratable H+).
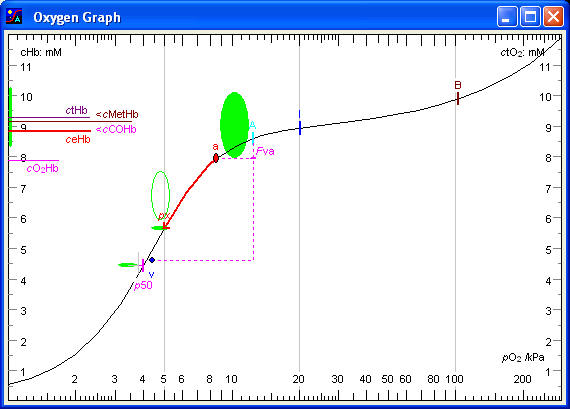
The Oxygen Graph illustrates the Oxygen Status of the blood. The four key quantities are: px (oxygen extraction tension), pO2 (oxygen tension), ceHb (oxygen binding capacity), and p50 (oxygen binding affinity).
The Blood Gas Map shows the relationship between the two blood gases. The key quantities are: pO2 and pCO2.
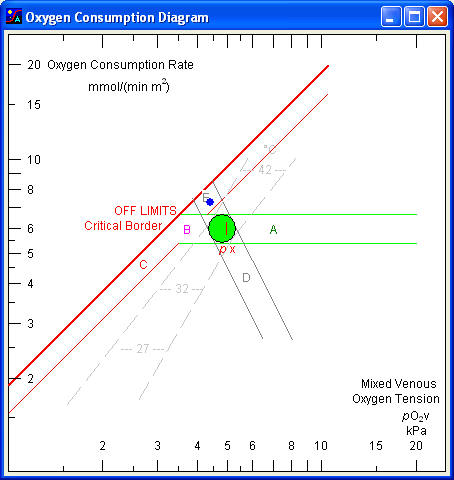
The Oxygen Consumption Diagram illustrates the critical border beyond which tissue hypoxia threatens. The two key quantities are: the mixed venous pO2 and the oxygen consumption rate.
The diagrams are displayed by the Oxygen Status Algorithm, a computer program which calculates the acid-base status and the oxygen status on the basis of a set of measured values. The effect of various therapeutic actions such as change in ventilation, infusion of acid or base, oxygen breathing, blood transfusion, etc. may be estimated.
pH - log pCO2 Diagram
Acid Base Status of the Blood
Arterial blood is indicated by a red point, venous blood by a blue point. Any point is characterized by four coordinates (pH, pCO2, ctH+Ecf, cHCO3-). When laboratory data (pH and pCO2) are plotted in the chart, the acid-base status is readily evaluated with reference to the normal area and areas of normal physiological compensation.
The abscissa is a linear pH scale with indication of the normal interval for arterial pH. Any point in the left half of the chart indicates acidaemia, any point in the right half alkalaemia.
Note: if hydrogen ion concentration is selected rather than pH in the OSA-program Setup (File Menu) then the abscissa is a logarithmic cH+ scale.
pH of the blood is the key parameter of the acid-base status. It is a function of two independent variables: carbon dioxide tension (pCO2) and concentration of added hydrogen ion in the extended extracellular fluid (ctH+Ecf), representing respiratory and non-respiratory (metabolic) acid-base disturbances, respectively.
The ordinate to the right is a logarithmic pCO2 scale with indication of the normal interval for arterial pCO2. Any point in the upper half of the chart indicates hypercapnia, any point in the lower half hypocapnia. pCO2 is regulated by the lungs.
The scale at the left and top of the chart shows the concentration of titratable hydrogen ion in the extended extracellular fluid (ctH+Ecf). Projections to the scale follow the slanting ctH+ lines. These 'vivo CO2 titration curves', show the change in pH with acute changes in pCO2 in vivo (for example due to acute changes of ventilation), where ctH+Ecf remains constant. The slope of the lines depends on the buffer value of non-bicarbonate buffers of the extracellular fluid. The latter corresponds to the buffer value of blood diluted three fold with its own plasma. The ctH+ lines are graphical representations of the Van Slyke equation. ctH+Ecf is regulated by the kidneys.
The horizontal scale in the middle of the chart (at a pCO2 of 5,3 kPa) shows the concentration of bicarbonate in the blood plasma (cHCO3P). Projections to the scale should be made at an angle of minus 45º to the scale. For this reason the divisions on the scale are slanting with slope -1 (-45º). The bicarbonate scale is a graphical representation of the Henderson-Hasselbalch equation.
Normal area
The elliptical area in the middle of the chart indicates values for normal resting individuals. For women and infants the point tends to fall in the lower left of the area, while normal values for men tend to fall in the upper right.
On a vegetable diet the point tends to fall in the right side of the area. On a protein-rich diet the point falls in the left side of the area. The point for the supine body position tends to fall in the upper half of the area, while values for the sitting or standing position tend to fall in the lower half.
Respiratory and non-respiratory acid-base disturbances
Acid-base disturbances are classified as respiratory and non-respiratory. Respiratory disturbances are characterized by and abnormal blood pCO2, non-respiratory disturbances by an abonormal concentration of titratable hydrogen ion in the extended extracellular fluid (ctH+Ecf). Non-respiratory disturbances are also called metabolic acid-base disturbances. A primary disturbance in any of these two variables is compensated by a change in the other variable in an attempt to reduce changes in blood pH.
This area (A) shows values for normal individuals following an acute elevation of pCO2, for example due to CO2 inhalation or apnoeic oxygenation. An alternative designation of the area is ‘acute respiratory acidosis’. Any point in this area is characterized by increased blood pCO2, decreased plasma pH, and normal ctH+Ecf.
This area (D) shows values for normal individuals immediately following hyperventilation. With longer duration of hyperventilation (more than 10 to 15 minutes), the values tend to fall in the left side of the area or even outside and to the left of the area. This is due to a rapid formation of lactic acid in the liver, which causes a fall in ctH+Ecf. An alternative designation of this area is ‘simple acute respiratory alkalosis’. Any point in this area is characterized by a decreased blood pCO2, increased plasma pH, and normal ctH+Ecf.
This area (B) shows values observed in patients, children as well as adults, with chronic respiratory insufficiency but with a normal renal function. An alternative designation is ‘chronic respiratory acidosis’.
The renal compensation is not maximal before several days after induction of hypercapnia. In the case of concomitant potassium depletion, the values tend to fall in the right side or to the right of the indicated area. In this case the renal function cannot be said to be normal, since the potassium depletion enhances the hydrogen ion excretion in the kidneys at a given plasma pH value.
The area is not extended beyond a pCO2 of 15 kPa because the concomitant fall in blood pO2 below 6 kPa when breathing atmospheric air becomes the limiting factor. Any point in this area is characterized by an increased blood pCO2, an elevated ctH+Ecf, and a normal or slightly decreased plasma pH.
This area (E) shows values observed in normal individuals acclimatized to high altitude. An alternative designation is ‘area of simple chronic respiratory alkalosis’. Any point in this area is characterized by a decreased pCO2, decreased ctH+Ecf, and normal or slightly increased pH.
This area (G) shows values obtained after acute production of non-volatile acid in the organism, i.e. lactic acid in connection with severe anaerobic muscular exercise or convulsions.
Acidaemia stimulates the peripheral chemoreceptors to hyperventilation, but in the most acute phase the acidity has not yet increased in the respiratory centre or in the cerebrospinal fluid, and the respiratory compensation is therefore only partial. Acute, in this connection, means of few minutes duration.
An alternative designation is ‘acute metabolic acidosis’. Any point in this area is characterized by negative ctH+Ecf, decreased pH, and a normal or slightly decreased pCO2.
This area (F) shows values observed in patients with a chronic H+ excess but with a normal respiratory function, i.e. chronic renal insufficiency or diabetic acidosis, or in normal subjects after ingestion of ammonium chloride. Values in this area are also observed in patients with diarrhoea with loss of HCO3¯. Maximal respiratory compensation develops when equilibrium is reached between the different body phases, more specifically between the extracellular fluid, the cerebrospinal fluid, and the respiratory centre. This lasts 4 do 6 hours after i.v. infusion of acid. An alternative designation of this area is ‘simple chronic metabolic acidosis’. Any point in this area is characterized by a positive ctH+Ecf, a decreased pCO2, and a decreased plasma pH.
This area (C) shows values obtained in individuals with a normal respiratory function after administration of bicarbonate, or observed in patients, children as well as adults, with a chronic H+ deficit. An alternative designation is ‘chronic metabolic alkalosis’.
In case of concomitant potassium depletion the values tend to fall in the lower part of the area or below the area. In this case the respiratory function cannot be said to be normal, since an increased hydrogen ion concentration is assumed to develop intracellular in the respiratory centre.
Any point in this area is characterized by a decreased ctH+Ecf, an increased plasma pH, and a normal or slightly increased pCO2.
Acute H+ deficit or acute metabolic alkalosis without respiratory compensation is rarely encountered in clinical practice and a reference area is therefore omitted. The area would greatly overlap the area of chronic H+ deficit with somewhat lower pCO2 values.
Using the Acid-Base Chart
When the laboratory data (measured pH and pCO2) are plotted in the chart, the acid-base status is readily evaluated with reference to the normal area and the areas of normal physiological compensation.
The Acid-Base diagnosis is a laboratory diagnosis which describes the pH value in relation to the normal interval, the cause of any abnormality in terms of increased or decreased pCO2 and/or ctH+Ecf changes, and finally any compensatory influence of either pCO2 or ctH+. For example: moderate acidaemia due to marked hypercapnia, partly compensated by slight metabolic H+ deficit.
The expected effects of acid-base therapy may be evaluated. Increasing the alveolar ventilation, voluntarily or artificially causes the arterial point to slide downwards along the ctH+ line. If the alveolar ventilation is doubled, and the blood pCO2 thereby halved, the new position of the point is easily predicted, and the concomitant rise in plasma pH may be accurately estimated.
The acute effect on the plasma pH of infusion of sodium bicarbonate may also be evaluated. Rapid infusion of 5 mmol of sodium bicarbonate per litre of extracellular fluid (which corresponds to about 1 mmol per kg body mass) initially causes a fall in ctH+Ecf of 5 mmol/L. The arterial point moves from one ctH+ line to the next line 5 mmol/L higher, the blood pCO2 remaining virtually constant. As the base is distributed in the whole body, the initial fall in ctH+Ecf of 5 mmol/L is about halved.
Acid-base status: description of the momentary arterial pH, pCO2, and ctH+Ecf.
Acid-base balance: description of the rate of input/output of H+. It is generally based on 24 h. In the case of unbalance, the acid-base status is changing. Determining the balance requires an account of all input (e.g. infusion of NaHCO3, NH4Cl, etc), and output (e.g. titratable acid plus ammonium in urine).
Limitations
The laboratory diagnoses should not be considered diagnoses in the clinical sense. For example, if the arterial point falls in the area of acute hypercapnia, the patient may suffer from acute hypoventilation with respiratory acidosis. However, the values might also be due to a chronic respiratory acidosis complicated by an acute metabolic acidosis. The laboratory data alone only allow the conclusion that the pH and pCO2 values fall within the area of acute hypercapnia. The clinical acid-base diagnosis requires knowledge on how the point arrived at the present location, i.e. knowledge of the path the point followed and or knowledge about the prior acid-base balance (intake, production and excretion of titratable hydrogen ion).
The different areas are not defined with mathematical accuracy. Many different factors influence the acid-base values of the blood. The normal area, for example, is dependent on age and sex, composition of the diet, body position, altitude, etc. The slope of the vivo CO2 titration curves is dependent on the buffer value of the extracellular fluid. For these reasons the areas should not be interpreted as more than indications of the acid-base values to be expected in certain types of acid-base disturbances.
log pO2-ctO2 Diagram
The most important function of the blood is transport of oxygen from lungs to tissues. Three conditions must be fulfilled: (1) the arterial oxygen tension (pO2a) must be sufficiently high to provide a diffusion gradient from the arterial end of the capillary to the cells, (2) the oxygen binding capacity of the blood (ceHb) must be sufficiently high to allow transport of the necessary amount of oxygen, and (3) the haemoglobin oxygen binding affinity (p50) must be appropriate for the binding of oxygen in the lungs and release of oxygen in the tissues. A disturbance in one of the parameters of the Oxygen Triad may be neutralized by a compensatory change in one or both of the other two, for example a low pO2a (hypoxemia) may be compensated by a high ceHb and/or a high p50. The parameter which indicates whether a disturbance is compensated or not is the oxygen extraction tension, px.
The extraction tension of oxygen in the arterial blood (px) is a measure of oxygen availability. It is defined as the oxygen tension resulting from removal of 2,3 mmol of oxygen per litre blood. The latter is the normal arterio-venous oxygen concentration difference. A decreased px indicates that the mixed venous pO2 is also decreased unless compensated by a decreased oxygen consumption rate and/or increased cardiac output.
The arterial oxygen extraction tension is a function of three principal variables: the arterial oxygen tension, the concentration of effective haemoglobin, and the half-saturation tension. Clinical terms to indicate disturbances in these three are ‘hypoxaemic hypoxia’, ‘anaemic hypoxia’, and ‘high-affinity hypoxia’.
The arterial oxygen tension (pO2a) is a function of four independent variables: ambient barometric pressure (Pamb), fraction of oxygen in dry inspired air (FO2dI), arterial carbon dioxide tension (pCO2a), and physiological veno-arterial shunt fraction (Fva). The latter two are the principal indicators of respiratory function.
The concentration of effective haemoglobin in the blood (ceHb) is a measure of the haemoglobin-oxygen binding capacity. It equals the concentration of total haemoglobin (ctHb) corrected for fractions of carboxyhaemoglobin (FCOHb) and methaemoglobin (FMetHb), which are unable to bind oxygen reversibly.
The half-saturation tension (p50) is a (reciprocal) measure of the haemoglobin-oxygen binding affinity. The oxygen binding affinity of normal haemoglobin depends on pH, concentration of 2,3-diphosphoglycerate in the erythrocytes (cDPG), fractions of carboxyhaemoglobin and methaemoglobin, and fraction of foetal haemoglobin (FHbF).
The relationship between px, pO2a, ceHb and p50 is illustrated by the Oxygen Graph.
pO2
The abscissa is a logarithmic pO2 scale, illustrating the Oxygen Cascade: the stepwise fall in oxygen partial pressure from dry (21 kPa) to humidified inspired air (approx. 20 kPa), to alveolar air (14 kPa), to the oxygen tension in alveolar capillary blood (14 kPa), to arterial blood (11 kPa), to the venous end of blood capillaries in the tissues (4,8 kPa), to mixed venous blood (5,0 kPa). The latter small rise is due to some arterio-venous shunting. The final fall is from the erythrocytes in the venous end of the capillaries (4,8 kPa) to the mitochondria (1,6 kPa). The mitochondria are satisfied as long as their pO2 is above 0,1 kPa. Below this level oxidative metabolism diminishes and glycolytic metabolism takes over. The safety margin for the mixed venous pO2 is therefore about 1,5 kPa, i.e. the critical mixed venous pO2 is about 3,5 kPa. The abscissa in the Oxygen Graph and the Gas Map illustrates several steps of the oxygen cascade.
ctO2
The ordinate is a linear concentration scale with the unit mmol/L (mM). The right ordinate shows the concentration of total oxygen in the blood (ctO2). The left ordinate shows total haemoglobin concentration (ctHb). The concentrations of carboxyhaemoglobin and methaemoglobin (cCOHb and cMetHb) are subtracted to provide the concentration of effective haemoglobin (ceHb), which corresponds to the haemoglobin oxygen binding capacity. A vertical band indicates the reference interval for the latter. The concentration of oxyhaemoglobin (cO2Hb) is also displayed. The position of the cO2Hb mark relative to the ceHb mark indicates the haemoglobin oxygen saturation fraction.
The oxygen binding curve illustrates the increase in oxygen concentration as the pO2 increases from the lowest to the highest end of the pO2 scale. The curve is S-shaped, rising slowly at low oxygen tensions, then increasing steeply at half-saturation, reaching a plateau at 100 % saturation of the haemoglobin corresponding to the effective haemoglobin concentration and finally increasing exponentially at high pO2 values due to physically dissolved oxygen. If the pO2 scale had been linear then the latter increase would be linear. The shape of the curve is calculated on the basis of the pO2 and the haemoglobin oxygen saturation fraction measured in the arterial blood, and a mathematical model of the haemoglobin oxygen binding called the Tanh Equation, a hyperbolic tangent function. Several marks are placed along the oxygen binding curve.
Mark ‘B’, indicates ambient, barometric pressure (Pamb).
Mark ‘I’, the next mark down the oxygen cascade, indicates pO2 of humidified (tracheal) inspired air (pO2hI). It is calculated as the fraction of oxygen in dry inspired air (FO2dI) times the pressure of dry air, which is total pressure minus water vapour pressure. A value around 20 kPa indicates that the patient is breathing atmospheric air. If the patient is breathing pure oxygen, the ‘I’ mark would be about 94 kPa, i.e. barometric pressure minus saturated water vapour pressure.
Mark ‘A’ indicates pO2 of (ideal) alveolar air (pO2Alv) and concentration of total oxygen of blood in equilibrium with alveolar air (ctO2Alv). pO2Alv is calculated from the Alveolar Air Equation. The fall in pO2 from inspired air to alveolar air is almost equal to the arterial pCO2, or more accurately pCO2Alv/RQ.
Point ‘a’ indicates the arterial pO2 (pO2a) and the concentration of total oxygen of the arterial blood (ctO2a). The values refer to patient temperature. The pO2 fall from alveolar air to arterial blood is due to physiological veno-arterial shunting (Fva). The normal area for the arterial point is indicated by the ellipse in the middle of the graph. It is approximately a 90 % normal area, i.e. 90 % of normal values fall inside the area, 10 % just outside.
Physiological veno-arterial shunting
The mark ‘Fva’ on the vertical line, extending from the alveolar mark ‘A’ to the level of the ‘px’ mark, indicates the fraction of venous admixture to the arterial blood: the apparent or physiological shunt fraction. If the ‘v’ mark for mixed venous blood is present, the vertical line extends to the ‘v’ mark. In a normal young person the apparent veno-arterial shunting amounts to 3 - 5 % of the blood (increasing towards 15 % with age).
Mark ‘p50’ indicates the oxygen tension at half-saturation. p50 is a reciprocal index of the haemoglobin-oxygen binding affinity. The lower the p50 value, the higher the haemoglobin-oxygen binding affinity, and vice versa. A horizontal bar at level with ‘p50’ mark indicates the normal interval, i.e. the normal position of the oxygen binding curve.
A longer tag at half saturation indicates the Standard p50. A left or right displacement from the normal interval indicates decreased or increased cDPG, respectively.
The concentration of total haemoglobin (ctHb) is indicated by a horizontal mark on the left ordinate.
A horizontal line below the total haemoglobin mark indicate total haemoglobin minus carboxyhaemoglobin.
The concentration of methaemoglobin is indicated by the difference between the carboxyhaemoglobin mark and the mark for effective haemoglobin.
The concentration of effective haemoglobin (ceHb) is indicated by a horizontal mark on the left ordinate. The concentration of effective haemoglobin corresponds to the haemoglobin oxygen binding capacity and is one of the key parameters of the oxygen status of the arterial blood. The reference interval is indicated by a vertical bar on the ordinate.
A horizontal mark on the left ordinate indicates the concentration of oxyhaemoglobin (cO2Hb). The haemoglobin oxygen saturation (sO2) is not displayed directly in the graph. It can be visualized by estimating oxyhaemoglobin as a fraction of effective haemoglobin.
Mark ‘px’ on the oxygen binding curve indicates the oxygen extraction tension of the arterial blood, i.e. the oxygen tension after reduction of the concentration of total oxygen by 2,3 mmol/L. The 'extraction arrow' starting at the arterial point 'a' and ending at the 'px' mark illustrates an extraction of 2,3 mmol of oxygen per litre of blood. The reference values are indicated by the oval area at the tip of the 'extraction arrow'.
The extraction tension is the single most important quantity of the arterial oxygen status. The most important property of the arterial blood is the ability to supply the tissues with oxygen without an excessive fall in pO2 at the venous end of the capillaries. Normally the tissues extract an amount of oxygen corresponding to 2,3 mmol/L and at the same time the oxygen tension falls from about 11 kPa in the arterial end of the capillary to about 5 kPa in the venous end. If the arterial blood is unable to supply 2,3 mmol/L, without a fall in oxygen tension below 4,5 kPa, then there is a disturbance in the oxygen status of the arterial blood. It could be due to a low arterial oxygen tension (pO2a), a low haemoglobin-oxygen binding capacity (ceHb), or a high haemoglobin-oxygen binding affinity (low p50), or a combination of all three. However, a disturbance in one of the three may be compensated by opposite changes in one or both of the other two. For example, a low arterial oxygen tension may be compensated by an increased haemoglobin concentration and/or an increased p50 value. Or a low haemoglobin concentration may be compensated by an increased oxygen tension.
Point ‘v’ indicates the pO2 and ctO2 of mixed venous blood. The mixed venous point is usually close to the ‘px’ mark because the normal arterio-venous oxygen concentration difference is close to 2,3 mmol/L. However, if the cardiac output is high, e.g. doubled, then the arterio-venous oxygen concentration difference is halved (as long as the oxygen consumption rate is unchanged). The venous point would then be halfway between the ‘px’ mark and the arterial point ‘a’. Similarly, if the cardiac output is halved, then the arterio-venous oxygen concentration difference would double, and the venous point would be as far below the ‘px’ mark as the arterial point ‘a’ is above. Hence the position of the mixed venous point ‘v’ relative to the ‘px’ mark gives some information on the cardiac output. It is important that the mixed venous pO2 remains above 3,5 kPa, where anaerobic metabolism and lactic acid formation may threaten, and certainly above 2,5 kPa, where cerebral hypoxia may threaten.
Using the Oxygen Graph
First observe the ‘px’ mark (the tip of the ‘extraction arrow’). If px is normal, there is no overall disturbance in the arterial oxygen availability, i.e. any abnormality in pO2, ceHb, or p50 is balanced by compensatory changes in one or both of the other. Then observe the arterial point to determine the presence or absence of arterial hypoxemia. Observe the distance between the marks ‘I’ and ‘A’. A large distance indicates hypercapnia (be aware that the scale is logarithmic). Observe the ‘Fva’ mark, which indicates the physiological veno-arterial shunting. Find the effective haemoglobin concentration on the left ordinate and see whether a low value is due to carboxy- or methaemoglobin. Observe the ‘p50’ mark and notice whether the oxygen binding curve is displaced towards left or right.
The Oxygen diagnosis is a laboratory diagnosis which describes the px value in relation to the normal interval, the cause of any abnormality in terms of pO2, ceHb, or p50, and finally any compensatory influence of the three. Then each of the three is described with indication of the cause of abnormality. For example: moderately decreased oxygen availability due to marked arterial hypoxemia and slight anaemia, partly compensated by slightly decreased haemoglobin oxygen affinity. The arterial hypoxemia is due to marked veno-arterial shunting together with moderate hypercapnia. The decreased haemoglobin oxygen affinity is due to a moderate acidaemia.
The log pO2 -log pCO2 Diagram
The Rahn-Fenn diagram (logarithmic)
The two blood gases, oxygen and carbon dioxide, are interdependent. An increase in pCO2 due to hypoventilation causes a decrease in alveolar and arterial pO2. A fall in arterial pO2 causes hyperventilation and fall in pCO2, due to hypoxic stimulation of the peripheral chemoreceptors. These relationships are illustrated by the Blood Gas Map.
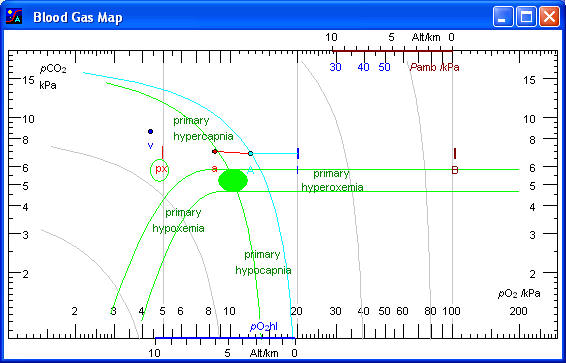
pO2 and pCO2 values measured in the arterial blood are plotted as a point (a) in the coordinate system. Corresponding values for “ideal” alveolar air, estimated by calculation are also plotted (A). The relative positions of the alveolar and arterial points provide important information on the pulmonary function. If measurements have been made on mixed venous blood, the mixed venous point (v) provides additional information.
Each element of the diagram is explained in the following with values for a 65 year old male person breathing atmospheric air at sea level and with a body temperature of 38,2 °C.
pO2
The abscissa is a logarithmic pO2 scale, extending from 1 kPa to 300 kPa, identical with the abscissa of the Oxygen Graph.
pCO2
The ordinate is a logarithmic pCO2 scale, extending from 1 to 20 kPa, identical with the ordinate in the Acid-Base Chart.
Mark ‘B’ at the horizontal level of ‘A’ and ‘I’ indicates ambient barometric pressure (Pamb). The altitude scales at the top and bottom show ambient pressure and pO2 of humidified inspired air as functions of altitude. For example, at the top of Mount Everest at an altitude of 9 km, Pamb is only 33 kPa and pO2hI only 3,5 kPa.
Note: One atmosphere (1 atm) is approximately 100 kPa. This means that at sea level, if fraction of a gas in a gas mixture is x %, then the partial pressure of that gas is approximately x kPa.
Mark ‘I’ next to the point ‘A’ indicates pO2 of humidified inspired air (pO2hI), which is approximately 20.0 kPa when breathing atmospheric air at sea level. It is calculated as the fraction of O2 in dry inspired air (0,21 for atmospheric air) times the barometric pressure minus saturated water vapour pressure at the temperature of the patient (6,3 kPa at 37 ºC).
Alveolar air pO2 and pCO2
Point ‘A’ represents alveolar air. pO2Alv is calculated from the Alveolar Air Equation. pCO2Alv equals the arterial pCO2 with a minor correction for veno-arterial shunting as shown by the Alveolar CO2 Equation. As a good approximation the alveolar pO2 equals the pO2 of the humidified inspired air minus pCO2Alv/RQ.
Note: Alveolar air here refers to “ideal” alveolar air, i.e. alveolar air from alveoles with the same local ventilation/perfusion ratio as the total overall ventilation/perfusion ratio. The point representing mixed alveolar air, obtained as a sample of end expired air, will be located on the hyperbolic “alveolar air line” slightly below the point ‘A’ due to dispersion of ventilation/perfusion ratios throughout the lung. Normally pO2Alv will be about 0,3 kPa lower than pO2 of end expired air due to ventilation/perfusion dispersion.
The curve through the point ‘A’, shows the relationship between pCO2 and pO2 of alveolar air, when pCO2 is the independent variable changing with changes of ventilation. The mathematical expression of the curve is the Alveolar Air Equation. If the alveolar ventilation is halved then the alveolar pCO2 will double, and the curve shows the concomitant fall in pO2. In a linear plot, the curve would be a straight line and the slope of the line would be almost equal to the RQ value (CO2/O2 exchange ratio) with a negative sign, i.e. normally around – 0,86.
Point ‘eE’ on the air curve slightly below ‘A’ shows the composition of mixed alveolar air, obtained as a sample of end expired air, sampled after washout of all inspired air from bronchi and trachea. pO2 of mixed alveolar air (eE) is always slightly higher than pO2 of ideal alveolar air (A) due to dispersion of the ventilation-perfusion ratio (V/Q) among different alveoles. In the upper parts of the lungs V/Q is always higher than in the lower parts. The presence of true alveolar dead space, i.e. unperfused alveoles, further contributes to the pO2 difference. The ratio between the A - eE difference and the A - I difference indicates the functional alveolar dead space as a fraction of the tidal volume, normally about 0,05.
Point ‘E’ on the air curve below ‘eE’ shows the composition of mixed expired air, traditionally collected in a Douglas bag. The air is a mixture of alveolar air and inspired air from the anatomical dead space. The ratio between the A - E difference and the A - I difference indicates the physiological dead space as a fraction of the tidal volume, normally about 0,25.
Arterial blood pO2 and pCO2
Point ‘a’ represents the pO2 and pCO2 of the arterial blood. The values refer to the actual temperature of the patient.
Normal area for the arterial point ‘a’ is shown as a green circle. For about 90 % of normal persons the arterial point falls in this area. For about 10 % of completely normal persons the point falls just outside the reference area.
The alveolo-arterial pO2 difference is the horizontal distance between the arterial point ‘a’ and the alveolar point ‘A’. It has been used as an index of pulmonary dysfunction. However, the estimated physiological veno-arterial shunt fraction (Fva) is a much better indicator of pulmonary function.
Another respiratory index which has become very popular is the ratio between the arterial pO2 and the fraction of oxygen in the inspired air, the pO2/ FO2 ratio. It can be estimated on the diagram as the ratio between the arterial pO2 and the inspired pO2. It is very easy to calculate, but it correlates poorly with the veno-arterial shunt fraction.
The arterial oxygen extraction tension
A red vertical line at level with the arterial pCO2 below the arterial pO2 indicates the oxygen extraction tension (px).
Point ‘v’ shows the pO2 and pCO2 of mixed venous blood. Access to mixed venous blood via a catheter in the pulmonary artery is an exception, and hence the venous point is generally missing. The circular area surrounding the point indicates the normal area for the venous point as well as the normal interval for the arterial oxygen extraction tension.
If the mixed venous pO2 is lower than the arterial oxygen extraction tension (px), this indicates a decreased cardiac output and/or increased oxygen consumption rate, whereas a mixed venous pO2 higher than px indicates an increased cardiac output and/or a decreased oxygen consumption rate.
The mixed venous pO2 is the most important indicator of global tissue hypoxia. As a rule of thumb, glycolysis and lactic acid formation is imminent when the mixed venous pO2 falls below 3,5 kPa. A value below 2,5 kPa involves a risk of cerebral hypoxia and hypoxic coma. It should be emphasized, however, that the mixed venous pO2 is a global parameter, which does not reveal redistribution of blood flow with local tissue hypoxia, normoxia, or hyperoxia.
The arterio-venous pO2 difference is related to the oxygen consumption, but due to the S-shape of the oxygen binding curve the same arterio-venous oxygen consumption (e.g. 2,3 mmol/L) may cause a very large a-v pO2 difference when the arterial pO2 is high but a quite small a-v difference when the arterial pO2 is low. The a-v oxygen consumption is more directly displayed in the Oxygen Graph.
Reference areas for arterial blood
Primary hypercapnia, hypercapnic hypoxaemia, or primary hypoventilation is the area running upwards from the normal arterial area along the hyperbolic curve.
Primary hypocapnia, hypocapnic hyperoxaemia, or primary hyperventilation extends downwards from the normal arterial area along the hyperbolic curve.
Primary hypoxaemia, hypoxaemic hypocapnia, or hypoxemic hyperventilation is the band curving downwards towards lower pO2 and pCO2 from the normal area for the arterial point. Breathing air with a low pO2, for example at high altitude, causes a hypoxic stimulation of the chemoreceptors resulting in increased ventilation and a decrease in pCO2.
Primary hyperoxaemia is the band extending horizontally towards higher oxygen tensions. For example increasing the inspired oxygen partial pressure, even with hyperbaric oxygenation does not change ventilation and pCO2.
Using the Gas Map
First observe pO2 of humidified inspired air (mark 'I'), which indicates whether the patient receives supplementary oxygen. Then observe the arterial point to determine whether hypercapnia or hypoxemia appears to be the primary disturbance. Finally observe the alveolo-arterial pO2 difference to get an impression of veno-arterial shunting and pulmonary insufficiency. If the mixed venous point is displayed then observe the mixed venous pO2, which is the most important indicator of global tissue hypoxia.
log pO2v versus log O2 consumption rate
Mixed venous pO2 and oxygen metabolism
The oxygen tension in mixed venous blood (pO2v) is a key parameter, being the indicator of the average end capillary pO2. The latter must be sufficiently high to allow adequate oxygen diffusion from erythrocytes to mitochondria. The mixed venous oxygen tension must be above a minimum critical level.
The mixed venous oxygen tension depends on three independent variables: oxygen consumption rate (ńO2), cardiac output (Q), and availability of oxygen in the arterial blood (px). A high oxygen consumption rate, low cardiac output, and decreased oxygen availability all cause a decrease in mixed venous pO2, ultimately suffocating the cells. The clinical terms are ‘hypermetabolic hypoxia’, ‘ischaemic hypoxia’, and ‘low-availability hypoxia’. The relationships between these variables are illustrated by the Oxygen Consumption Diagram.
In intensive critical care it is important to ensure, that the mixed venous pO2 is above the critical value. This not only requires measurement of the mixed venous pO2 but also measurement of the cardiac output and calculation of the oxygen consumption rate. If the mixed venous point is close to the critical border, attempts should be made to increase the mixed venous pO2 (by increasing the arterial px or the cardiac output) or decrease the oxygen consumption rate (sedation, cooling).
Oxygen tension
The abscissa is a logarithmic pO2 scale extending from 1 to 25 kPa.
Oxygen consumption rate
The ordinate is a logarithmic scale for oxygen consumption rate (ńO2) divided by body surface area (mmol min-1 m-2), also called the areic oxygen consumption rate. The ordinate also indicates the areic oxidative energy production rate (W m-2), based on a molar energy of oxygen reduction of 450 kJ/mol.
Mixed venous blood
The point 'v' indicates the measured mixed venous pO2 and the calculated oxygen consumption rate.
Arterial oxygen extraction tension
The arterial oxygen extraction tension (px) is indicated by a vertical mark situated at the level of a normal oxygen consumption rate. An increased px may be due to increased arterial pO2, increased ceHb, or increased p50. A mixed venous point to the right of the px mark indicates increased cardiac output and/or decreased oxygen consumption rate; a point to the left indicates decreased cardiac output and/or increased oxygen consumption rate.
Reference areas
Normal area
The area shows values for normal resting persons with a normal mixed venous pO2 and a normal areic oxygen consumption rate with consideration of age and sex.
This area, extending horizontally to the right of the normal area, indicates increased mixed venous pO2 due to increased arterial px and/or increased cardiac output. If the increase is due to an increased px (e.g. oxygen inhalation) the metabolic rate remains unchanged. An increase in cardiac output causes a minor increase in oxygen consumption due to the energy requirements of the working heart. Therefore the point tends to fall in the upper part of the area. In a normal person doubling the cardiac output increases the mixed venous pO2 from about 5 kPa to about 6,6 kPa.
Moderate mixed venous hypoxaemia
The area extending horizontally to the left of the normal area until the critical border indicates decreased mixed venous pO2 but values that are still above the critical border and sufficiently high to sustain a normal oxygen consumption rate. The cause of the decrease may be a decreased arterial px and/or decreased cardiac output. If cardiac output is halved in a normal person the mixed venous pO2 falls from about 5 kPa to about 3,5 kPa, i.e. to the critical border.
Critical mixed venous hypoxaemia
The area continuing downwards along the oblique critical border indicates decreased mixed venous pO2 to values too low to sustain a normal oxygen consumption rate. The latter falls in direct proportion to the fall in mixed venous pO2. Energy production must then rely on glycolytic metabolism with lactic acid formation. One molecule of glucose provides only two molecules of ATP, one molecule of oxygen produces six. The energy produced by reduction of oxygen is about 450 kJ/mol, somewhat dependent upon the kind of fuel (carbohydrate, fat or protein). Useful chemical energy associated with hydrolysis of ATP is about 50 kJ/mol, in other words, the efficiency of the oxidative metabolism is about 67 %, much higher than most man made engines.
The area running downwards from the normal area with slightly increasing mixed venous pO2 illustrate values due to a primary decrease in oxygen requirements. The cause may be a hormonal regulation (myxoedema) or sedation. The slope of the relationship is about -2.
The area running in the opposite direction, upwards from the normal area indicates primary increase in oxygen requirements. This causes a fall in mixed venous pO2. At the same time the critical mixed venous pO2 rises and the critical border is soon reached. Hypermetabolism may be due to a hormonal regulation but also to a toxic uncoupling of oxidative ATP formation. Several drugs are known to block the normal coupling between reduction of one molecule of oxygen and formation of six ATP. Examples are coumarins, 2,4-dinitrophenol, FCCP, CCCP.
Hypothermia causes decreasing metabolic rate and decreasing mixed venous pO2. The area of hypothermia indicates the effect of different temperature levels. Metabolic rate decreases about 9 % per degree. Cardiac output is likely to decrease equally much so that the arterio-venous oxygen concentration difference remains constant. Hence the change in mixed venous pO2 with temperature equals the change in the position of the oxygen dissociation curve, i.e. the change in half-saturation tension.
The permeability coefficient for oxygen decreases about 1 % per degree. Therefore the critical mixed venous pO2 rises slightly. Nevertheless, the slope of the relationship between oxygen consumption rate and mixed venous pO2 is steeper than 45 °C, and hence the safety margin, i.e. the difference between the mixed venous pO2 and the critical border, increases.
The arterial pH and pO2 may be regulated according to the α-stat approach (poikilothermic animals), where pH and pCO2 are allowed to change as in blood in vitro, which means keeping pH and pCO2 constant at 37 °C. This is achieved by keeping ventilation unchanged. Another approach is the pH-stat (hibernating animals), where pH and pCO2 are kept constant at patient temperature, by allowing CO2 to accumulate by hypoventilation. The α-stat approach gives values in the left side of the hypothermia area, the pH-stat approach slightly higher mixed venous pO2 values in the right side to the area. However, both approaches, α-stat and pH-stat, result in mixed venous pO2 values on the safe side of the critical border.
During hyperthermia values fall in the area extending upwards as a prolongation of the hypothermia area. Metabolic rate increases and mixed venous pO2 also increases but the safety margin to the critical border diminishes.
The critical border is the oblique line extending from a low metabolic rate, where a low mixed venous pO2 is sufficient to ensure adequate diffusion of oxygen from erythrocytes to mitochondria, to a high metabolic rate, where a high mixed venous pO2 is needed. There is direct proportionality between the two quantities and therefore the slope is 1 (45°).
The position of the critical border is changeable. Muscular activity is associated with capillary recruitment and a diminished average distance from erythrocytes to mitochondria. Therefore a lower end capillary pO2 is sufficient to ensure the necessary oxygen diffusion. The critical border is shifts to the left.
Arterio-venous shunting causes admixture of arterial blood to the end capillary blood and hence a higher mixed venous pO2 as well as critical pO2. The critical border is shifts to the right. Luxury perfusion, especially of organs with low oxygen consumption such as skin, has a similar effect. It should be recalled that the mixed venous pO2 is a global parameter which represents a weighted mean of end capillary pO2 values ranging from quite low values (heart and brain) to values approaching the arterial value (kidney and skin).
Cytotoxic (or histotoxic) hypoxia also shifts the critical border to the right. With a toxic inhibition of the cytochromes a higher oxygen partial pressure is needed at the mitochondrial level to ensure oxygen reduction and ATP formation.
Using the Oxygen Consumption Diagram
The position of the mixed venous point in relation to the normal area is observed. The reference areas assist in the interpretation of causes of an abnormal mixed venous pO2 or oxygen consumption rate. Values close to the critical border should cause attention and possibilities of increasing the mixed venous pO2 or decreasing the oxygen consumption rate should be considered. However, the possibility that the critical border is right shifted (e.g. by functional a-v shunting) should always be kept in mind. If that is the case a normal mixed venous pO2 and normal oxygen consumption rate might be at the critical border and tissue hypoxia might prevail. Therefore it is essential to use other indicators of tissue hypoxia, e.g. rise in blood lactate, before tissue hypoxia is ruled out. In critically ill patients it has been shown that supra-optimal values, i.e. being well on the safe side, improve the outcome.
The list contains systematic descriptions of each quantity:
Reference values.
Extreme values.
Causes and effects of pathological values.
The order of the quantities is based on a chemical and physiological classification:
TPt, Tm
pHT, pHm, cH+T, pHstd
ctH+Ecf, ctH+B, ctH+P, cBBˉP = "SID", cAlbP, FBEcf
pCO2T, pCO2m, cdCO2P
cHCO3, cHCO3std, ctCO2P, ctCO2B
Pamb, FO2dI, pO2hI, RQ, Fva, pO2Alv, pO2T, pO2m, px, pO2v
sO2T, sO2m, ctO2, cdO2, cO2Hb, ctO25, cx, DctO2av, DctCO2va
p50T, p50std, cDPG, FHbF
ctHb, ceHb, FCOHb, FMetHb
Q, QA, m, h, A, ńO2, ńAO2, WAO2
TPt
Causes and effects of change in temperature
|
|
Causes |
Values |
Effects |
|
Hyperthermia |
Malignant hyperthermia. |
(42,5) |
Increased O2 consumption rate. |
|
Normal |
|
37,5
|
|
|
Hypothermia |
Therapeutic. |
slight |
Rise in pHa. |
In the present context all values refer to patient temperature unless otherwise specified.
Temperature coefficients for pH, pCO2, pO2, aO2, and pH2O(sat.) (see pO2hI) are described elsewhere.
pH
The hydrogen ion activity is generally expressed in terms of pH, defined as:
pH = -lgaH+ (negative (decadic) logarithm of the hydrogen ion activity).
Chemical activity of an ion (e.g. H+) is not measurable. Electrochemical activity of an ion is measurable, but separation in the electrical and the chemical parts must be based on a convention. Chemical activity of an uncharged molecule, e.g. HCl (which dissociates into H+ and Cl-), is measurable, but a convention is needed to separate the activity in the contributions from hydrogen ion and chloride ion. The present convention for measuring hydrogen ion activity (pH) is based on a convention for calculating the molal activity of the chloride ion from the molality of chloride ion.
Negative pH is directly proportional to the chemical potential of hydrogen ions:
μH+ = - (R · T) · ln10 · pH
R is the gas constant and T is absolute temperature.
The chemical potential of hydrogen ion is the intensive quantity related to the hydrogen ions. The extensive quantity is the stoichiometric amount of hydrogen ion, generally expressed as the stoichiometric concentration or the concentration of added (or removed) hydrogen ion or the concentration of titratable hydrogen ion.
In aqueous solutions the activity of hydrogen ions is closely associated with the activity of the hydroxyl ions via the acid dissociation constant of water (KA):
KA = (aH+ · aOHˉ)/aH2O
In dilute aqueous solutions aH2O → 1,0. Using p as symbol for the operator 'negative dacadic logarithm' the equation therefore simplifies to:
pKA = pH + pOH, with pKA = 13,6 at 37 °C.
Free hydrogen ion concentration, cH+
Hydrogen ion concentration may be calculated from pH:
cH+ = antilg (-pH) · ρH2O · mº/γ
γ = 0,8 (the activity coefficient for H+ in normal plasma),
ρH2O = 0,993 kg/L (mass density of pure water at 37 °C),
mº = 1 mol/kg.
Generally, however, the equation is simplified to:
cH+ = antilg (-pH) · cº
cº = 1 mol/L.
pH = 7,40 => cH+ = 39,8 nmol/L
The calculated cH+ actually expresses the activity of hydrogen ions with the unit mol/L.
Some authors recommend using cH+ rather than pH to avoid using a logarithmic expression.
Free hydroxyl ion concentration, cOH-
The hydroxyl ion concentration may be calculated from pOH by the following simplified equation:
cOH- = antilg (-pOH) · cº
pH = 7,40 => pOH = 6,20 => cOH- = 631 nmol/L.
In a biological system, at pH = 7,40, the hydroxyl ion concentration is 16 times higher than the hydrogen ion concentration. It is tempting to conclude, that the hydroxyl ion is more important than the hydrogen ion. However, in most chemical reactions it is the hydrogen ion that participate, not the hydroxyl ion. It would be redundant to report both pH and pOH, or both hydrogen ion concentration and hydroxyl ion concentration.
pH is usually measured with a glass electrode and a reference electrode using a saturated KCl bridge solution.
Measuring the pH of whole blood provides the pH of the continuous phase, i.e. the plasma pH. A small bias is due to the effect of the erythrocytes on the liquid junction potential. The bias is normally about - 0,01 but increases to about - 0,04 at very high haemoglobin (erythrocyte) concentrations. The cause of the bias was originally thought to be a 'suspension effect'. We have shown that the effect is due to an osmotic crenation of the erythrocytes with dilution of the surrounding plasma. The effect is reduced with a flow junction which reduces the time for the osmotic effect to occur.
It is essential to specify, whether the pH value refers to the temperature of measurement (37 °C), pHm, or to the patient temperature, pHT.
Blood pH is the pH of the blood plasma, the continuous phase of blood.
Causes and effects of change in pHa
|
|
Causes |
Values |
Effects |
|
High pHa Alkalaemia. |
Low ctH+Ecf
(<–3 mM). |
(7,8) |
Tetany (fall in cCa2+. |
|
Normal (Neutralaemia) |
|
7,43 |
|
|
Low pHa Acidaemia. |
High ctH+Ecf (>3
mM). |
slight |
Rise in p50. |
Reference values
| Women | Men | |
| pH | 7,38 - 7,44 | 7,37 - 7,43 |
| cH+ (nmol/L) | 36,3 - 41,7 | 37,2 - 42,7 |
Hypothermia
1.The 'pH-stat' theory assumes that optimal values for pH (referring to the actual patient temperature) remain about 7,4 regardless of the patient temperature. This requires that pCO2 (referring to actual patient temperature) is maintained about 5.3 kPa. During hypothermia this is achieved by hypoventilation with accumulation of CO2 in the body. During warming the accumulated CO2 must be eliminated by hyperventilation. This is observed in hibernating animals.
2.The 'alpha-stat' theory assumes that the optimal values are the values obtained as if the blood was cooled in vitro, i.e. increasing pH (at the actual temperature) but constant pH (referred to 37 °C) with decreasing temperature. Such values maintain the ionization of the alpha-amino groups of proteins unchanged, hence the name 'alpha-stat'. This is observed in poikilothermic animals, where acute changes in temperature do not allow a slow accumulation and elimination of CO2 to occur, and where ventilation is virtually unchanged. Proponents of this theory prefer to always refer pH and pCO2 to 37 °C.
A comparison of the two approaches on mixed venous pO2 and oxygen consumption rate is shown in the Oxygen Consumption Diagram.
Calculation
pH at patient temperature is calculated from the value measured at 37 °C using the pH-temperature coefficient for blood.
Mixed venous blood pH is about 0,02 lower than pHa, i.e. reference values 7,35-7,42.
pH of the erythrocyte fluid (E) is about 0,2 lower than the plasma pH due to the membrane potential across the erythrocyte membrane:
pHE = pHE° + (dpHE/dpHP) · (pHP - pHP°).
pHE° = 7,19.
dpHE/dpHP = 0,77.
pHP° = 7,40.
Erythrocyte membrane potential
The membrane potential (yE – yP ) may be calculated from the pH difference between plasma and erythrocyte fluid:
yE - yP = - (R·T / zH+·F) · ln(aH+E/aH+P).
R = 8,314 41 J·K-1·mol-1 (molar gas constant).
F = 96 484,56 C·mol-1 (Faraday constant).
T = 310 K (absolute temperature) (≈ 37 °C).
zH+ = 1 (charge number of the ion).
aH+E/aH+P = 0,616 (at pHP = 7,40).
y E - y P = – 13,0 mV (at pHP = 7,40).
Standard pH, pHstd
pHstd is defined as pH in blood standardized by gas equilibration to pCO2 = 5,33 kPa and pO2 > 80 kPa. It is closely related to standard bicarbonate (cHCO3std), and has been suggested as an indicator of a metabolic acid-base disturbance but is now obsolete.
Hydrogen ion titratable concentration
ctH+
The concentration of titratable hydrogen ion in blood or plasma (ctH+) is defined as the concentration of hydrogen ion determined by titration with strong acid or base to an end point pH of 7,40, at a pCO2 = 5,33 kPa, at 37 °C. When the initial pH is above 7,40 (at pCO2 = 5.33 kPa) the titration is performed with a strong acid (e.g. HCl); the result is a negative value for the concentration of titratable hydrogen ion. When the initial pH is below 7,40 (pCO2 = 5,33 kPa) the titration is performed with a strong base (e.g. NaOH); the result is a positive value for the concentration of titratable hydrogen ion.
The titration should be performed without changing the haemoglobin oxygen saturation, because increasing the oxygen saturation would liberate hydrogen ions and cause a higher value for ctH+. This is called the Haldane effect.
The end point of titration is a natural physiological reference point. Blood in the body is an open system in equilibrium with the alveolar air in the lungs. pCO2 is an independent variable. Therefore the titration is performed in an open system at constant pCO2 rather than in a closed system at constant concentration of total carbon dioxide.
The amount of titratable hydrogen ion is the extensive quantity while the activity of hydrogen ions is the intensive quantity related to hydrogen ions.
Acids and bases may be described by the following reaction
HA ↔ H+ + A-
HA is an acid, a hydrogen ion donor. Aˉ a base, a hydrogen ion receptor (Brønsted 1923, Lowry 1923). If the equilibrium is displaced completely to the right, HA is a strong acid e.g. HCl, H2SO4. If the equilibrium is displaced completely to the left A- is a strong base. If an equilibrium between HA and A- exists, HA is called a weak acid and A- a weak base e.g. OH- (as NaOH). The set of weak acid and corresponding weak base is called a buffer, consisting of a buffer acid and corresponding buffer base. A buffer pair is characterized by the equilibrium constant of the reaction:
KA = (cH+ · cA-)/cHA, or in rearranged logarithmic form:
pH = pKA + lg(cA-/cHA).
HA may be a cation, electrically neutral, or an anion. Examples are NH4+, lactic acid, and H2PO4-. Similarly A- can be electrically neutral, or an anion, for example NH3, HCO3-. The most important buffer groups in blood are the imidazole amino groups of histidine, which are abundant in haemoglobin. At physiological pH (7,4) an acid group with a pKA < 4,4 may be considered a strong acid. Similarly a base group corresponding to an acid group with a pKA > 10,4 may be considered a strong base.
An aprote is a molecule that neither releases nor binds hydrogen ions (protons), for example glucose and urea. Some molecules are aprote at physiologic pH but may be acids at higher pH, e.g. NH4+. Similarly, some molecules are bases only at pH lower than physiologic pH, e.g. lactate ion.
Formerly cations were identified with “base” (except for H+), while anions (except OH-) were “acids”. A cation cannot be added without simultaneously adding an anion. Adding a cation (for example Na+) together with an anion (for example Clˉ) is the same as adding a salt (NaCl). However, adding an anion together with a hydrogen ion (e.g. adding HCl) is in effect adding a proton donor. So, in aqueous solutions the old and the new definitions of acid and base are mutually consistent. The former definition of acid and base focuses on the anion (acid) accompanying the hydrogen ion and the cation (base) exchanging for it (the Stewart approach).
Calculation of titratable hydrogen ion
In practise ctH+ is calculated from pH and pCO2, referring to 37 °C, with the Henderson-Hasselbalch equation and the Van Slyke equation, using ctHb as a measure of the buffer value of the blood.
Terminology
The concentration of titratable hydrogen ion may also be called the stoichiometric concentration of hydrogen ion or the concentration of added hydrogen ion or excess hydrogen ion.
With opposite sign it is numerically equal to the concentration of titratable hydrogen ion binding groups, i.e. the concentration of titratable base, generally called the concentration of excess base, or briefly the Base Excess (BE). In chemistry the term base designates a hydrogen ion binding group. Until 1923, however, base was synonymous with cation, a usage which still adheres.
The concentration of titratable hydrogen ion in blood plasma, ctH+P, may be calculated from the pH and pCO2 values using the Van Slyke equation. ctH+P falls slightly when pCO2 increases in vivo, indicating a transfer of H+ from the weakly buffered plasma into the well buffered erythrocyte fluid. Due to this change in ctH+P in a pure respiratory disturbance ctH+P is not the ideal indicator of a non-respiratory (metabolic disturbance).
The concentration of titratable hydrogen ion in whole blood, ctH+B, may be calculated from the pH and pCO2 values and the haemoglobin concentration using the Van Slyke equation. ctH+B increases slightly when pCO2 increases in vivo, indicating a transfer of H+ from the weakly buffered interstitial fluid into the better buffered blood.
Extended extracellular fluid ctH+
Definition
Extended extracellular fluid designates extracellular fluid including erythrocytes. If the erythrocytes were distributed throughout the extracellular fluid the haemoglobin concentration would be about one third the haemoglobin concentration of the blood. A model of the extended extracellular fluid may therefore be constructed by diluting a blood sample three fold with its own plasma. This model has a buffer value representative of the average buffer value of the extended extracellular fluid.
The concentration of titratable hydrogen ion in the extended extracellular fluid, ctH+Ecf, actually refers to this model of the extended extracellular fluid. The value may be calculated using the Van Slyke equation.
Causes and effects of changes in ctH+Ecf
|
|
Causes |
Values |
Effects |
|
High ctH+Ecf (positive values) |
Metabolic acidosis. |
(+35) |
Fall in pHa. (rise in cH+) |
|
Normal |
|
+2,5 |
|
|
Low ctH+Ecf (negative values) |
Metabolic alkalosis |
slight |
Rise in pHa. (fall in cH+) |
Reference values
Women: – 2,3 to +2,7 mM.
Men: – 3,2 to +1,8 mM.
Interpretation
ctH+Ecf remains virtually unchanged upon acute changes in pCO2. Although a change in pCO2 causes a redistribution of hydrogen ions within the extended extracellular fluid, any transfer of hydrogen ions between the intracellular and extracellular fluid is minimal. Therefore ctH+Ecf is the best indicator of a non-respiratory acid-base disturbance.
A non-respiratory (also called metabolic) acid-base disturbance may be defined as an abnormal concentration of titratable hydrogen ion in the extended extracellular fluid (ctH+Ecf). In other words, metabolic acidosis is synonymous with increased ctH+Ecf. Metabolic alkalosis is synonymous with decreased (negative) ctH+Ecf. Some authors use the terms metabolic acidosis and alkalosis to indicate a pathophysiological process, e.g. an ongoing excessive accumulation or loss of hydrogen ion. A non-respiratory disturbance may be primary or secondary, i.e. compensatory to a primary change in pCO2.
With opposite sign ctH+Ecf has been called the standard base excess (SBE). ctH+Ecf might be called the standard hydrogen ion excess with the acronym SHE.
Note: ctH+B, ctH+P, and ctH+Ecf are identical at a special combination of pH and pCO2 values. These values represent the so-called ctH+ curve in the pH, lg pCO2 curve nomogram. The equation of the curve may be derived from the Van Slyke equation.
Blood as volume fraction of extended extracellular fluid, FBEcf
The extended extracellular fluid is the extracellular fluid including the blood erythocytes. The default value is FBEcf = 0,33. In newborn infants the interstitial fluid volume is relatively larger and FBEcf may be as low as 0,2. FBEcf is used for calculation of the haemoglobin concentration of the extended extracellular fluid:
ctHbEcf = ctHbB · FBEcf.
ctHbEcf is needed for calculation of the non-bicarbonate buffer value of the extended extracellular fluid. In the Oxygen Status Algorithm calculation program the default value is used unless the user keys in another value. The influence upon the calculated ctH+Ecf is generally clinically insignificant.
Buffer capacity for hydrogen ion in a solution is defined as
B = ∂ noH+ / ∂ lg aH+ = ∂ noBase /∂ pH.
noH+ is amount of substance of added H+ (added together with an indifferent anion, e.g. Cl-); with opposite sign this equals added base.
Other independent variables are constant, usually temperature, pressure, and amount of substance of other components. Occasionally the intensive quantity rather than the amount of substance is considered the independent variable, e.g. pCO2 rather than nCO2. This must be clearly specified because the value of B will be different when either nCO2 or pCO2 is constant.
Molar buffer capacity of solute C is defined as
BmC = ∂ B / ∂ nC.
BmC = 0,576 for an H+ binding group at pH = pKa
Buffer value for hydrogen ion in a solution is defined as buffer capacity divided by volume:
β = B / V
β = ΣB (BmC · cC).
Buffer values for plasma, albumin, and haemoglobin
βP = 10,4 mM (buffer value of plasma at pH = 7,40 in closed system at constant ctCO2 = 26,2 mM)
βP = 64,3 mM (buffer value of plasma at pH = 7,40 in open system with pCO2 = 5,3 kPa).
βP = 7,7 mM (buffer value of plasma at pH = 7,40 in CO2 free system, i.e. pCO2 = 0).
The latter value is the buffer value of non-bicarbonate buffers in plasma.
BmAlb = 8,0 (molar buffer capacity of albumin at pH = 7,40).
BmHb = 3,0 (molar buffer capacity of haemoglobin (monomer) at pH = 7,40).
In whole blood (B) the apparent molar buffer value of haemoglobin is lower because pH refers to plasma pH, not erythrocyte pH:
BmHbB = BmHbE · (dpHE/dpHP) = 3,0 · 0,77 = 2,3.
The buffer capacity of gammaglobulin is practically zero at pH = 7,40.
The buffers of the blood prevent dramatic changes in pH when H+ is added or removed. For example, adding 30 mmol of H+ (together with Clˉ) to 1 litre of blood in a closed bottle causes a rise in concentration of free hydrogen ions of only about 0,36 mmol/L (fall in pH from 7,4 to 6,4). 99,7 % of added H+ is bound by hydrogen ion binding groups (base groups) of the proteins. The carbonic acid/bicarbonate buffer system plays a minor role.
However, in an open bottle, where the pCO2 is kept constant (at 5,3 kPa) by allowing CO2 to escape, the fall in pH is much smaller: from 7,4 to about 6,8. Now the carbonic acid/bicarbonate system becomes very important. The added H+ is bound to HCO3- forming H2CO3 which splits into water and CO2. The latter disappears in the gas phase. This is the situation in the body which is an open system where the blood is in equilibrium with the alveolar air.
The buffer value of a given buffer system depends on the pH value, the pKA of the buffer acid, and the concentration of the buffer:
pH = pKA + lg (cA-/cHA),
cA- = ctA/(antilg(pKA – pH)+1).
The concentration of buffer anion as a function of pH describes the titration curve of the buffer.
Differentiation gives the buffer value as function of pH (aH+), KA, and concentration of buffer (ctA):
βA = ln(10) · ctA · KA · aH+ / (KA + aH+)2
The titration curve of a pure albumin solution may be calculated from the pK values of all buffer groups of the albumin molecule. Due to the many different buffer groups with different pK values, the titration curve is practically a straight line in the pH interval from 6,8 to 7,8, as pointed out by Van Slyke as early as 1918. The same result is obtained by titration of a sodium albuminate solution with hydrochloric acid. The slope of the titration curve at any pH is the buffer value.
Definitions
Buffer base (BBˉ) is defined as the concentration of buffer anions minus the concentration of buffer cations (the latter being virtually zero at physiological pH). In plasma or whole blood, buffer base therefore is the sum of HCO3ˉ, net albumin anion, and phosphate.
Strong ion difference (SID) is defined as the concentration of non-buffer cations minus the concentration of non-buffer anions. SID of plasma therefore is the sum of the concentrations of Na+, K+, Ca2+, Mg2+ minus the sum of the concentrations of Clˉ, SO42+, and certain organic anions, which also represent non-buffer anions at physiological pH.
BBˉ and SID are obviously numerically equal, because the sum of all cations must equal the sum of all anions (law of electroneutrality).
The concentration of buffer base with opposite sign is numerically equal to the concentration of titratable hydrogen ion, titrating with strong acid (HCl) in a CO2 free system to a pH value corresponding to the overall isoionic pH of non-bicarbonate buffers. In the case of plasma titrating to the isoionic pH of albumin at pCO2 = 0 titrates all albumin and bicarbonate ions. From a physiological point of view titrating to pH of 7,40 at a pCO2 of 5,3 kPa to seems to be a more relevant than titrating to the isoionic pH of albumin.
Hydrogen ions cannot be added to a solution without adding a concomitant anion, or removing another cation (law of electro-neutrality). The key component is the hydrogen ion, neither hydrogen ion binding groups (base), nor non-buffering cations and ions.
Buffer base as measure of a non-respiratory acid-base disturbance
Buffer base was introduced as a measure of added non-carbonic acid or base, i.e. as a measure of non-respiratory acid-base disturbances. Adding carbonic acid causes an increase in bicarbonate but an almost identical fall in non-bicarbonate anions. Hence buffer base remains constant during changes in pCO2 in vitro. However, a change in the concentration of non-bicarbonate buffers, e.g. albumin or haemoglobin, also changes the concentration of buffer base, without reflecting any accumulation or loss of non-carbonic acid or base. Therefore buffer base is not an ideal indicator of metabolic acid-base disturbances. Singer and Hastings therefore recommended using delta buffer base (∆BBˉ), i.e. buffer base minus the normal buffer base. Normal buffer base is the buffer base after titrating the blood or plasma to a normal pH and pCO2 (7,40 and 5,3 kPa). ∆BBˉ (with opposite sign) and the concentration of titratable hydrogen ion are numerically equal.
Protein anion concentration in plasma
The total protein concentration in normal plasma is about 7,0 g/dL (6,0 - 8,0 g/dL). The net negative charge of protein in normal plasma at pH = 7,40 is about 14 mM, albumin accounting for about 12 mM.
Albumin concentration in plasma, cAlbP
The albumin concentration in normal plasma is about 0,66 mM (0,53 - 0,79 mM).
In newborns (<1 week) and elderly (>70 y) values are about 17 % lower. In the prone position values are about 7 % higher due to haemoconcentration.
The molar mass of albumin is 66438 g/mol, hence a substance concentration of 0,66 mM corresponds to a mass concentration of 4,4 g/dL.
The net negative charge of an albumin molecule at pH = 7,40 is about 18, resulting from a total of 88 negative and 70 positive charges.
The molar buffer capacity of albumin in the physiological pH range is 8,0. In normal plasma, albumin therefore contributes by 5,3 mM to the total non-bicarbonate buffer value of 7,7 mM, i.e. albumin accounts for 69 % of the non-bicarbonate buffer value, the remainder being due to phosphate, and globulins (to a minor extent).
The Oxygen Status Algorithm calculation program uses a default value: cAlbP = 0,66 mM unless the user keys in another value. The influence of cAlbP on the calculated ctH+Ecf is generally clinically insignificant.
Arterial blood pCO2
Causes and effects of change
|
|
Causes |
Values |
Effects |
|
Hypercapnia (respiratory acidosis) |
CO2 inhalation. |
(30) |
Fall in pH. |
|
Normal (women) |
|
5,8 |
|
|
Hypocapnia (respiratory alkalosis) |
Hyperventilation. |
slight |
Vasoconstriction (skin, brain). |
Reference values
pCO2 should always refer to the temperature of the patient to allow estimation of the alveolar pCO2, pO2, and the physiological shunt fraction (Fva).
Women: 4,59 - 5,76 kPa.
Men: 4,91 - 6,16 kPa.
High altitude
pCO2(h) = pCO2(h°) + β · h,
where h is altitude, pCO2(h°) is the value at sea level, and β = – 0,333 kPa/km.
Hypothermia
Alpha-stat approach for pH regulation: reference pCO2 falls with temperature as in a blood sample in vitro.
pH-stat approach for pH regulation: reference pCO2 remains constant regardless of temperature.
pCO2 is measured with a pCO2 electrode (Stow/Severinghaus electrode). pCO2m refers to the measurement temperature. The value referring to patient temperature, pCO2T, is calculated from pCO2m, using the pH temperature coefficient and taking ctCO2P to be constant.
Respiratory acidosis is synonymous with hypercapnia, i.e. increased pCO2.
Respiratory alkalosis is synonymous with hypocapnia, i.e. decreased pCO2.
Respiratory disturbances may be primary or secondary, i.e. compensatory to a primary disturbance in concentration of titratable hydrogen ion.
A few authors recommend using the concentration of dissolved carbon dioxide in plasma, cdCO2P, rather than pCO2 in an attempt to express all components in blood or plasma in terms of substance concentrations. This cannot be recommended because the close relationship between pCO2a and pCO2Alv would then be lost. Dissolved carbon dioxide includes the small amount of carbonic acid, H2CO3.
The concentration of dissolved carbon dioxide in plasma may be calculated as the product of pCO2 and the solubility coefficient, αCO2P.
cdCO2P = pCO2 · αCO2P
αCO2P = 0,230 mM/kPa (at 37 °C)
αCO2 and pCO2 must refer to the same temperature.
pCO2 of mixed venous blood is about 1 kPa higher than the arterial pCO2. Contrary to the mixed venous pO2, the mixed venous pCO2 has no clinical relevans. It is needed for calculation of the concentration of total carbon dioxide in mixed venous blood.
Carbon dioxide total concentration
Plasma ctCO2P
The concentration of total carbon dioxide in plasma comprises: dissolved CO2, H2CO3, HCO3-, CO32-, and carbamino CO2. The latter is CO2 bound to terminal amino groups of proteins.
Formerly the measured ctCO2 was used together with the measured pH to calculate pCO2. Even earlier it was used together with pCO2 measured in end expired air to estimate the blood pH.
Reference values
Women: 22,3 - 28,4 mM.
Men: 23,3 - 29,7 mM.
Measurement
all CO2 is extracted at a pCO2 of zero. The extracted CO2 is measured gasometrically, colorimetrically, or by titration (reference method). Most chemical analyzers measure ctCO2 by colorimetry.
Calculation
ctCO2 = cdCO2 + cHCO3.
The calculated ctCO2 may deviate from the measured, especially when cHCO3 is calculated with the Henderson-Hasselbalch equation using a constant pK value regardless of ionic strength. In that case cHCO3 actually represents the bicarbonate activity as it would be measured with an ion-selective electrode for bicarbonate. Therefore at high ionic strength the bicarbonate concentration is underestimated. At high pH carbonate and at high pCO2 carbamino CO2 are underestimated. In case of severe hyperlipidaemia, the measured ctCO2 may be significantly lower than the calculated.
ctCO2B is rarely measured directly but estimated from pH, pCO2, and ctHb.
It is used for calculation of the a-v ctCO2 difference, which when multiplied by the cardiac output provides the CO2 production rate. The a-v ctCO2 difference is normally about 1,9 mM, slightly less than the a-v total oxygen concentration difference of about 2,3 mM. The ratio between the two is the CO2/O2 exchange ratio or respiratory quotient (RQ).
Arterial blood plasma cHCO3¯
Causes and effects of change
|
|
Causes |
Values |
Effects |
|
High cHCO3 |
Low ctH+Ecf
(negative). |
(+60) |
Binding of Ca2+. |
|
Normal |
|
29 |
|
|
Low cHCO3 |
High ctH+Ecf
(positive). |
slight |
|
Reference values
Women: 21,2 - 27,0 mM.
Men: 22,2 - 28,3 mM.
Calculation
The bicarbonate concentration is calculated from pH and pCO2 using the Henderson Hasselbalch equation. Since pH and pCO2 are both related to chemical activity, cHCO3 also represents the bicarbonate ion activity provided constant pK and αCO2 are used for the calculation.
Alternative calculation: cHCO3 = ctCO2 – cdCO2. This gives the substance concentration including all CO2 species other than dissolved CO2. A discrepancy between activity and concentration arises with changes in ionic strength and ion pair formation. The difference has no clinical implications.
The bicarbonate concentration
is mainly used to indicate a low or high ctH+. It is also used to calculate
buffer base and anion gap.
Apart from Ca2+
binding, the bicarbonate ion has no special effects.
Standard Bicarbonate
Standard bicarbonate, cHCO3std or SBC, is defined as cHCO3P in blood standardized by gas equilibration to pCO2 = 5,33 kPa and pO2 > 80 kPa. It is calculated from pHstd with the Henderson Hasselbalch equation. It was used to indicate a metabolic acid-base disturbance but is now obsolete.
Barometric pressure
Pamb
Causes and effects of change
|
|
Causes |
Values |
Effects |
|
High |
Hyperbaric chamber: |
300 170 |
Rise in pO2hI |
|
Normal |
|
101,325 |
|
|
Low |
High Altitude. |
33 |
Fall in pO2hI |
Pamb falls with increasing altitude (h):
Pamb = Pº · (1 + (dT/dh) · h/Tº) f
Pº = 101,325 kPa,
Tº = 288 K,
dT/dh = -6,5 K/km, and
f = 5,256.
Pamb as a function of altitude is illustrated at the top of the Blood Gas Map.
Dry inspired air FO2dI
Causes and effects of change
|
|
Causes |
Values |
Effects |
|
High |
(Pure oxygen) |
1,00
|
Rise in pO2hI |
|
Normal |
|
0,2095 |
|
|
Low |
Accidental. |
0 |
Fall in pO2hI |
FO2dI is only known when the patient is breathing atmospheric air or pure oxygen with a tight mask, or on a respirator with known composition of the oxygen supply. When the patient receives supplementary oxygen with a mask, FO2dI may be calculated from the O2/air ratio. When receiving pure oxygen through a nasal catheter FO2dI may be estimated from the oxygen flow rate. Although the estimate may be inaccurate it nevertheless allows an estimate of pO2Alv and Fva.
Estimation of FO2dI from O2/Air mixture:
|
O2/Air |
FO2dI |
O2/Air |
FO2dI |
|
|
0/15 |
0,21 |
8/7 |
0,65 |
|
|
0/14 |
0,25 |
9/6 |
0,70 |
|
|
2/13 |
0,30 |
10/5 |
0,75 |
|
|
3/12 |
0,35 |
11/4 |
0,80 |
|
|
4/11 |
0,40 |
12/3 |
0,85 |
|
|
5/10 |
0,45 |
13/2 |
0,90 |
|
|
6/9 |
0,50 |
14/1 |
0,95 |
|
|
7/8 |
0,55 |
15/1 |
1,00 |
Estimation of FO2dI from flow of pure oxygen:
|
O2 flow (L/min) |
FO2dI |
O2 flow (L/min) |
FO2dI |
|
|
0 |
0,21 |
8 |
0,51 |
|
|
1 |
0,25 |
9 |
0,54 |
|
|
2 |
0,28 |
10 |
0,58 |
|
|
3 |
0,32 |
11 |
0,62 |
|
|
4 |
0,36 |
12 |
0,65 |
|
|
5 |
0,40 |
13 |
0,69 |
|
|
6 |
0,43 |
14 |
0,73 |
|
|
7 |
0,47 |
15 |
0,77 |
Humidified inspired air pO2hI
Causes and effects of change
|
|
Causes |
Values |
Effects |
|
Increased |
High Pamb |
(300) |
Rise in pO2Alv |
|
Normal |
|
20,8 |
|
|
Decreased |
Low Pamb |
Slightly |
Fall in pO2Alv |
Calculation
pO2hI = FO2dI · (Pamb – pH2OhI);
pH2OhI is saturated water vapour pressure, which varies with temperature:
pH2OhI = pH2O37 · exp((dlnpH2O/dT) · ∆T + 0,5 · d2lnpH2O/dT 2) · ∆T 2)
pH2O37 = 6,275 kPa
dlnpH2O/dT = 0,0543 /K;
d2lnpH2O/dT 2 = –0,00044 /K2
∆T = TPt – To
To = 37 °C.
Carbon dioxide / oxygen exchange ratio
(Respiratory quotient) RQ
Causes and effects of change
|
|
Causes |
Values |
Effects |
|
High |
Acute hyperventilation. |
4 |
Small increase in pO2A |
|
Normal |
Carbohydrate metabolism: |
1,0 |
|
|
Low |
Retention of CO2. |
slight |
Small decrease in pO2A |
Interpretation
The ratio between the CO2 elimination rate and the O2 consumption rate is called the CO2-O2 exchange ratio, or the respiratory quotient (RQ) . The normal value is about 0,85 on a normal mixed diet. Pure carbohydrate metabolism produces exactly the same amount of CO2 as the amount of O2 consumed, i.e. RQ = 1. Pure lipid metabolism give an RQ = 0,7. A value above 1 indicates a non-steady state, where the CO2 elimination rate is temporarily increased (e.g. acute hyperventilation or acute lactic acid production). A value below 0,7 indicates a non-steady state, where CO2 is temporarily accumulating in the body, e.g. acute hypoventilation or developing metabolic alkalosis. At steady state there is no correlation between the V/Q ratio and the RQ.
The RQ may be determined by analysis of inspired and expired air as the ratio between amounts of CO2 eliminated divided by amount of oxygen taken up. Another approach is to determine the ratio between the veno-arterial total CO2 concentration difference and the arterio-venous total O2 concentration difference.
RQ = DctCO2 va/DctO2 av.
CO2 elimination in the urine presents a source of bias in case of alkaline urine with significant amounts of bicarbonate.
The regional pulmonary RQ values are closely correlated to the regional V/Q values.
For V/Q approaching zero, RQ approaches the value of pCO2v/(pO2hI – pO2v) which is approximately 0,4 with atmospheric air.
For V/Q approaching infinity, RQ approaches the value of ctCO2v/(ceHb – ctO2v), which is approximately 9.
The following values apply to model calculations where the overall RQ is taken to be 1,0:
V/Q =0,25 → RQ = 0,43, V/Q = 0,5 → RQ =0,6, V/Q =1,0 → RQ =1,0, V/Q =2,0 → RQ =1,5, V/Q=4,0 → RQ =2,5.
Alveolar air pO2Alv
Causes and effects of change
|
|
Causes |
Values |
Effects |
|
High |
High pO2hI. (high RQ). |
(300) |
Rise in pO2 a. |
|
Normal |
|
15,0 |
|
|
Low. |
Low pO2 hI. (low RQ) |
(1,0) |
Fall in pO2 a |
Reference values
Women: 13,4 - 15,0 kPa.
Men: 13,0 - 14,5 kPa.
Calculation: from the alveolar air equation.
Notice that in the present text alveolar air designates ideal alveolar air, i.e. alveolar air from alveoles with the same ventilation-perfusion ratio as the overall ventilation perfusion ratio for the whole lung. Mixed alveolar air may be obtained as end expiratory air after wash out of all air in the dead space. pO2 of mixed alveolar air is always slightly higher (about 0,3 kPa) than pO2 of ideal alveolar. This is a consequence of the dispersion of the V/Q ratio among different alveoles.
Carbon dioxide partial pressure
Alveolar air pCO2Alv
The alveolar pCO2 is often assumed to equal the arterial pCO2 because diffusion equilibrium is rapidly established between alveolar capillary blood and alveolar air. However, due to ventilation-perfusion dispersion the pCO2 of mixed capillary blood from all alveoles is slightly higher than the alveolar pCO2. In the presence of true veno-arterial shunting the difference increases as shown by the alveolar CO2 equation.
Physiological veno-arterial shunt fraction
Fva
Causes and effects of changes
|
|
Causes |
Values |
Effects |
|
Increased |
Pulmonary "shunting": ventilation/perfusion dispersion |
(0,75) |
Fall in pO2a. |
|
Normal |
|
0,11 |
|
|
Decreased. |
Not pathologic |
(0) |
|
Reference values
The normal mean value (x) for Fva increases with age from about 0,02 at age 1 year to 0,15 at age 119 years:
Fva(mean) = 0,02 + 0,0013 · age/y.
Normal interval: [x/1,5; x ·1,5]
Calculation
The apparent fraction of mixed venous admixture in the arterial blood is called the physiological shunt fraction (Fva). It is calculated with the shunt equation.
Sources of error
An erroneous, negative value for Fva results if pO2a is higher than pO2Alv. pO2a may be erroneously high if an erroneously high TPt was entered, or pO2Alv may be erroneously low if too low FO2dI or RQ was entered. The actual TPt in the lungs may be lower than thought and the actual RQ may be higher than thought, especially if the patient hyperventilates.
The physiological shunt fraction is the sum of the true anatomical shunt fraction, the apparent shunt fraction due to regional ventilation-perfusion dispersion, and the apparent shunt fraction due to lack of diffusion equilibrium. The value of the physiological shunt fraction in a normal young adult is about 5 % (3 – 7 %), arising as the sum of 2 % anatomical shunt, 3 % apparent shunt due to alveolar V/Q dispersion, and 0 % due to lack of diffusion equilibrium. The physiological shunting increases to about 12 % at the age of 70 years (7 – 17 %). Contributing to the normal anatomical shunt are bronchial veins draining into the pulmonary veins and cardiac veins draining into the left atrium (veins of Thebesius).
The physiological shunt fraction is among the best indicators of the pulmonary function and has found widespread clinical application in advanced intensive care units and departments of respiratory disorders. It is far more informative than the pO2/FIO2 ratio which is much employed in less specialized departments.
A series of indices have been proposed as indicators of pulmonary dysfunction caused by dispersion of the ventilation/perfusion ratio (the V/Q ratio), true shunting, and diffusion barrier. Since it is difficult to distinguish the three mechanisms it is appropriate to include all three in the total physiological shunt fraction, Fva.
A very popular index is the pO2/FO2dI ratio, which is easily calculated, but it is a poor indicator of pulmonary dysfunction. Other indices are the alveolo-arterial pO2 difference, the arterio-alveolar pO2 ratio, and the so-called respiratory index, which is the alveolo-arterial pO2 difference divided by the arterial pO2. The alveolo-arterial ctO2 difference is equal to the numerator in the definition of Fva. None of these are correlated as well to pulmonary dysfunction as Fva.
Ventilation-perfusion ratio (V/Q)
The ventilation-perfusion ratio is the ratio between the alveolar ventilation (V) and the pulmonary blood flow rate (Q). The normal mean value is about 0,9. In states of chronic hyperventilation, e.g. high altitude, the value may be significantly increased although both ventilation and cardiac output tend to rise. In states with predominant increase in cardiac output, e.g. severe anaemia, the value may be significantly decreased. In spite of such pathological variations, determination of V/Q has not found any routine clinical application.
Alveolar V/Q dispersion
The V/Q values of the individual alveoles show dispersion with a mean value equal to the overall V/Q ratio. Due to the hydrostatic pressure both V and Q are lower at the apex of the lungs than at the base, but Q more than V. Hence V/Q is higher at the apex than at the base for a person in the upright position. As a result of the alveolar V/Q dispersion the arterial pO2 is lower than the pO2 of the alveolar air while the arterial pCO2 is higher than the alveolar pCO2. This is so even when complete diffusion equilibrium for O2 and O2 is attained in each individual alveole. In other words, even if the pO2 and pCO2 are completely identical in air and blood leaving each individual alveole, the mixture of blood from all the alveoles has a lower pO2, than pO2 of the (ideal) alveolar air, which is lower than the mixed air from all the alveoles (end expiratory air). Similarly, pCO2 of the mixed blood is slightly higher than pCO2 of the (ideal) alveolar air, which is higher than pCO2 of mixed alveolar air. The difference is the same as if some venous blood had been shunted through the lungs without getting into contact with alveolar air.
A V/Q of zero for any alveole or lung section, e.g. atelectasis, is identical with true anatomical shunting. A V/Q of infinity for any alveole or lung section is identical with physiological dead space.
The alveolar V/Q dispersion is not a quantity available for routine clinical measurement. However, being aware of the possibility of an increased V/Q dispersion is important for the interpretation of an increased physiological shunt fraction.
We have used a simple model, assuming that V/Q = 2 in the upper half of the lungs (two volumes of air plus one volume of blood) and ½ in the lower half (one volume of air and two volumes of blood). The overall result is V/Q = 1. We also assume that the overall RQ = 1 (carbohydrate diet).
It is possible to calculate the equilibrium condition when a given volume of humidified air with pO2 = 20 kPa and pCO2=0 kPa is brought to equilibrium with a given volume of venous blood with pO2 = 5,21 kPa, pCO2 = 6,04 kPa, cHb = 7,7 mM, p50std = 3,58 kPa, pH = 7,355, ctO2 = 5,52 mM, ctCO2 = 22,8 mM.
The equilibrium condition for O2 requires that the pO2 of air and blood attains the same value, that the amount of O2 taken up by the blood equals the amount given off by the air, and that the Bohr and Haldane effects are taken into account. Similar conditions apply for CO2: the amount given off by the blood must equal the amount taken up by the air.
In the upper half of the lungs at equilibrium we calculate for air and blood: pO2 = 17,2 kPa and pCO2 = 3,8 kPa. In the blood ctO2 = 7,80 mM, ctCO2 = 19,5 mM, pH =7,57. The RQ is 1,5.
In the lower half of the lungs at equilibrium we calculate for air and blood: pO2 = 11,1 kPa and pCO2 = 5,55 kPa. In the blood ctO2 = 7,49, ctCO2 = 21,6, pH = 7,372. RQ is 0,57.
When the two volumes of air from the upper lungs are mixed with the single volume of air from the lower lungs we get pO2eE = 15,2 kPa and pCO2eE = 4,38 kPa (eE for end expired air or mixed alveolar air).
When the two volumes of blood from the lower lungs are mixed with the single volume of blood from the upper lungs we get ctO2 = 7,59 mM and ctCO2 = 20,9 mM. From these concentrations we calculate pO2a = 12,2 kPa, pCO2a = 5,08 kPa, and pHa = 7,406. The physiological shunt fraction calculated with these values is 0,03.
The model is equivalent to lungs with an overall V/Q of 1 and a log-normal distribution of alveolar V/Q values with a standard deviation of the ln(V/Q) distribution of 0,96. This gives a 95 % interval for the V/Q values from 1/7 to 7. Hence we have shown that a V/Q dispersion of this magnitude causes an apparent shunt fraction of 0,03.
Similar calculations were performed with V/Q values of 4 for the upper lungs and ¼ for the lower lungs. This is equivalent to a V/Q dispersion with a 95 % interval extending from 1/50 to 50 which causes an apparent shunt fraction of 0,11.
Arterial blood pO2
Causes and effects of change
|
|
Causes |
Values |
Effects |
|
Hyperoxaemia |
High pO2Alv |
(300) |
Oxygen toxicity: |
|
Normal |
|
13,0 |
|
|
Hypoxaemia |
Low pO2Alv |
slight |
Fall in px. |
Reference values
Women (50 yr): 9,2 - 12,5 kPa (decreasing with age).
Men: 9,1 - 12,4 kPa (decreasing with age).
pO2 of the arterial blood should always refer to the actual patient temperature in order to be able to compare pO2 in inspired air, alveolar air, and blood, and to calculate the physiological shunt fraction.
Measurement
pO2 is measured with a pO2 electrode, usually at 37 ºC. I use the symbol pO2m on order to distinguish it from pO2a, the arterial pO2 referring to the temperature of the patient. The latter is calculated from pO2m using the pO2 temperature function.
Causes and effects of change
|
|
Causes |
Values |
Effects |
|
Venous |
High CI. |
(100) |
|
|
Normal |
|
5,5 |
|
|
Venous |
Low px. |
slight |
Tissue hypoxia. |
Reference value
Mean value: 5,0 kPa.
The mixed venous pO2 indicates the average end capillary pO2, being slightly higher due to some arterio-venous shunting (mostly in the skin). A sufficiently high end capillary pO2 is necessary to maintain an adequate O2 diffusion gradient from erythrocytes to mitochondria. With a normal mixed venous pO2 of 5 kPa the average cell pO2 is about 1,6 kPa. A fall in mixed venous pO2 to 3,5 kPa indicates that the cell pO2 has decreased to 0,1 kPa, the critical pO2 for oxidative metabolism in the mitochondria. Therefore the critical mixed venous pO2 is taken to be 3,5 kPa at 37 ºC. Temperature coefficient: dlnpO2/dT = 0,055 /K. The "critical" mixed venous pO2 is illustrated in the Critical Diagram.
The critical mixed venous pO2 is higher than 3,5 kPa in the following situations:
in the presence of pathological arterio-venous shunting,
when the average diffusion distance increases (for example generalized oedema),
when the oxygen consumption rate increases.
Arterial blood px
Causes and effects of change
|
|
Causes |
Values |
Effects |
|
Increased |
High pO2a. |
(100) |
None. |
|
Normal |
|
5,5 |
|
|
Decreased |
Low pO2a. |
slight |
Decrease in pO2v. in cardiac output. |
Definition:
The oxygen extraction tension is defined as the oxygen tension obtained when the concentration of total oxygen of the arterial blood is reduced by 2,3 mmol/L.
Reference values
Women: 4,30 - 5,26 kPa.
Men: 4,44 - 5,42 kPa.
Measurement
px could in principle be measured by adding an oxygen binding agent to the blood in an amount of 2,3 mmol/L and measuring the resulting pO2.This is not a routine procedure but it illustrates that px is not an abstract index.
Calculation
px is calculated from ctO2a – 2,3 mmol/L, using the TANH-equation as illustrated in the Oxygen Graph.
Notice that the imprecision of the calculation increases seriously when the measured haemoglobin oxygen saturation fraction exceeds 0,97.
Interpretation
px is the best indicator of the ability of the blood to allow extraction of oxygen (2,3 mmol/L) without reducing the pO2 below the normal mixed venous level of about 5 kPa. 2,3 mmol/L is the normal a-v oxygen concentration difference. It is the most important parameter of the oxygen status of the arterial blood, indicating whether a disturbance in any of the three quantities, pO2a, ceHb, or p50, is uncompensated or compensated by an opposite change in one or both of the other two.
If the cardiac output and the oxygen consumption rate are normal, then the px value approximately indicates the value of the mixed venous pO2. If the cardiac output is increased or oxygen consumption rate decreased then the a-v ctO2 difference will be less than 2,3 mmol/L and the mixed venous pO2 will be higher than px, whereas a decreased cardiac output or increased oxygen consumption rate causes a lower mixed venous pO2 than the px. In other words, a low px value may be compensated by an increased cardiac output and/or a decreased metabolic rate.
Oxygen haemoglobin saturation fraction
Arterial blood sO2
Causes and effects of change
|
|
Causes |
Values |
Effects |
|
Increased sO2a |
High pO2a. |
(100) |
High cO2Hb and ctO2. |
|
Normal |
|
0,989 |
|
|
Low sO2a |
Low pO2a. |
|
Low cO2Hb and ctO2. |
The haemoglobin oxygen saturation fraction is the fraction of haemoglobin oxygen binding sites actually occupied by oxygen. If all binding sites are occupied then haemoglobin is saturated with oxygen and the saturation fraction is one.
sO2 = cO2Hb/ceHb.
Sometimes sO2 is erroneously defined as cO2Hb/ctHb. COHb and MetHb are unable to bind oxygen at physiologic oxygen tensions. Therefore sO2 refers to ceHb. cO2Hb refers to reversibly bound oxygen. Oxygen bound to haemoglobin H is bound irreversibly at physiological pO2 and should therefore be excluded.
Reference values
Women (50 yr): 0,943 - 0,968.
Men (50 yr): 0,945 - 0,969.
Measurement
sO2 is measured by multiwavelength spectrophotometry.
Careful calibration of sO2 = 1,000 is required. With some instruments it is necessary to take the pH effect on the haemoglobin spectrum into account.
sO2m is the oxygen saturation referring to measurement temperature, usually 37 ºC. sO2 at patient temperature is calculated from sO2m. The change in sO2 with temperature is very small. The cause of a small change is the fact that p50 changes more with temperature than blood pO2. Therefore slightly more oxygen is haemoglobin bound and slightly less physically dissolved when temperature falls.
Reference value
Mean value for mixed venous blood: sO2 = 0,70.
Measurement
The mixed venous oxygen saturation may be measured directly with a fiberoptical sensor placed in the pulmonary artery. Catheter tip sensors are also available for pO2, but they are not as reliable as the reflectometric sO2 sensors. For this reason sO2v has become more popular than pO2v as a measure of mixed venous hypoxaemia.
Interpretation
sO2v is less suitable for detection of a risk of tissue hypoxia than pO2v. A fall in pO2v to 3,5 kPa directly signals a risk of tissue hypoxia since the diffusion gradient for oxygen from the venous end of the capillaries to the mitochondria tends to be too low. sO2v does not have a similar alarm value. In other words, the cells at the venous end of the blood capillaries “can feel” the pO2 value, whereas they are unaware of the sO2 value.
Arterial blood cO2Hb
Causes and effects of change
|
|
Causes |
Values |
Effects |
|
High cO2Hb |
High ceHb. |
(15) |
Rise in ctO2. |
|
Normal |
|
10,1 |
|
|
Low cO2Hb |
Low ceHb. |
slight |
Fall in ctO2. |
Reference values
Women (50 yr): 7,01 - 8,92 mM.
Men (50 yr); 7,85 - 9,99 mM.
Biochemistry
Oxyhaemoglobin (O2Hb) refers to haemoglobin with a reversibly bound oxygen molecule, whereas deoxyhaemoglobin (formerly called reduced haemoglobin) is haemoglobin with a free oxygen binding group.
Note: Oxygen bound to HbH (an abnormal haemoglobin) should not be included in O2Hb when calculating the p50 value since it is virtually irreversibly bound at physiological pO2.
Calculation
cO2Hb = sO2 · ceHb.
Arterial blood ctO2
(Blood oxygen content)
Causes and effects of change
|
|
Causes |
Values |
Effects |
|
High ctO2 |
High pO2a. |
(17) |
Rise in px. |
|
Normal |
|
10,2 |
|
|
Low ctO2 |
Low cO2Hb. |
slight |
Fall in px. |
Reference values
Women (50 yr): 7,11 - 9,05 mM.
Men (50 yr); 7,95 - 10,12 mM
Calculation
ctO2 is calculated from the total oxygen equation as ctO2 = cO2Hb + cdO2 (conc. of physically dissolved oxygen).
Oxygen delivery is defined as the product of the concentration of total oxygen in the arterial blood and cardiac output:
Oxygen delivery = ctO2a · Q
Oxygen delivery has been used as indication of a risk of tissue hypoxia: if oxygen delivery falls below a critical level, the oxidative metabolism falls and anaerobic metabolism takes over. However, the critical level depends on the haemoglobin-oxygen binding affinity (p50). This could be accounted for by calculating the extractable oxygen delivery: cx · Q. Nevertheless, the mixed venous pO2 is a much better indicator of the risk of tissue hypoxia. If mixed venous blood is not available, then the arterial oxygen extraction tension (px) is the quantity of choice.
The concentration of total oxygen in mixed venous bloood is calculated as a means of determining the arterio-venous oxygen concentration difference (DctO2av). Normally DctO2av is about 2,3 mmol/L.
Oxygen extractable concentration
Arterial blood cx
Causes and effects of change
|
|
Causes |
Values |
Effects |
|
Increased cx |
High pO2a. |
(7) |
None |
|
Normal |
|
2,8 |
|
|
Decreased cx |
Low pO2a. |
slight |
Decrease in pO2a. |
Definition
Concentration of extractable oxygen in the arterial blood, cx, is defined as the concentration of oxygen in the arterial blood minus the concentration at a pO2 of 5 kPa. It could also be called the concentration of titratable oxygen titrating to pO2 = 5,0 kPa at 37 ºC using an oxygen binding agent for titration.
Measurement
The concentration of extractable oxygen may be measured by titration of the blood with an oxygen binding agent until the pO2 is 5,0 kPa. When the arterial pO2 falls to 5 kPa, cx falls to zero, and cx is negative if the arterial pO2 is below 5 kPa, i.e. no oxygen can be extracted; oxygen must be added to obtain a pO2 of 5 kPa.
Reference values
Women (50 yr): 1,62 - 2,53 mM.
Men (50 yr): 1,74 - 2,72 mM.
Interpretation
The concentration of extractable oxygen in the blood gives an estimate of the arterio-venous oxygen concentration difference, on the assumption that the mixed venous pO2 is 5 kPa, which is its normal mean value. cx provides the same information as px and is redundant when px is reported.
Arterial blood p50
Causes and effects of change
|
|
Causes |
Values |
Effects |
|
High p50. |
Abnormal Hb. Low pHa. |
(7) |
Decrease in sO2a. |
|
Normal |
|
3,85 |
|
|
Low p50. |
Low cDPG. Abnormal Hb. |
slight |
Decrease in px. |
Definition
The halfsaturation tension is defined as the oxygen tension required to obtain an oxygen saturation fraction of 0,5 at a constant pH.
Reference values
Women: 3,24 - 3,92 kPa.
Men: 3,18 - 3,84 kPa.
The halfsaturation tension is calculated from the measured pO2 and pO2 using the TANH-equation. The measured pO2 and pO2 determine one point on the haemoglobin oxygen binding curve, enough to determine the whole curve through that point. The curve referring to patient temperature is determined on the basis of the coefficient: (∂ ln pO2 /∂ T) = 0,055 at constant sO2. The temperature coefficient is independent of the sO2 level.
Values for calculated p50, cDPG, and px should not be applied if the measured sO2 exceeds 0,97. If the imprecision of the measured sO2 is higher than 0,001 this limit should be reduced to 0,95 or less. If the arterial sO2 exceeds this value it is preferable to use a venous sample for determination of p50.
Interpretation
The negative logarithm of p50 is directly proportional to the haemoglobin oxygen binding affinity. p50 is one of the key parameters of the so-called oxygen triad: pO2a, p50, and ceHb.
(normal pH, pCO2, FCOHb, FMetHb, FHbF, 37 ºC)
Causes and effects of change
|
|
Causes |
Values |
Effects |
|
High p50std |
High cDPG.
|
(7) |
High p50. |
|
Normal |
|
3,75 |
|
|
Low p50std |
Low cDPG. |
slight |
Low p50. |
Definition
Standard p50 is defined as p50 referring to blood with normalized pH, pCO2, FCOHb, FMetHb, and FHbF.
Reference values
Women: 3,32 - 4,02 kPa.
Men: 3,21 - 3,88 kPa.
Calculation
from the measured pO2, sO2, pH, pCO2, FCOHb, FMetHb, and FHbF using the TANH-model of the haemoglobin-oxygen binding function.
Interpretation
Deviation of p50std from the normal value indicates a change in cDPG, or the presence of a haemoglobin variant. If the estimated cDPG value is reported it is redundant to report p50std as well.
2,3-Diphosphoglycerate concentration
Erythrocytes cDPG
Causes and effects of change
|
|
Causes |
Values |
Effects |
|
High cDPG |
High pHa |
(10) |
Rise in p50 |
|
Normal |
|
5,9 |
|
|
Low cDPG |
Low pHa |
slight |
Fall in p50 |
Reference values
Women: 4,5 - 6,2 mM.
Men: 4,1 - 5,6 mM.
Calculation
cDPG is calculated from p50std. The parameters are:
(∂ ln pO2 /∂ (cDPG/cDPG°))|sO2 = 0,3 – 0,1 · FHbF (for sO2=0,867)
cDPG° = 5,0 mM.
cDPG is illustrated in the Oxygen Graph by p50std. A displacement of the p50std mark to the left of the mark for normal p50 indicates a decreased cDPG.
If sO2 is above 0,97 the calculated cDPG is uncertain. In this case it is recommended to draw a venous sample (with a lower sO2) for calculation of cDPG which is then used for calculating the arterial oxygen parameters using pO2 and cDPG as input variables.
Interpretation
An erroneous value for the calculated cDPG may be due to the presence of a haemoglobin variant with abnormal Hb-O2 affinity. Another cause of an erroneous cDPG may be analytical error. A negative cDPG or a value above 10 mM indicates an error of measurement, either in sO2 (especially with sO2 values above 0,97), or in pO2a.
FHbF
Causes and effects of change
|
|
Causes |
Values |
Effects |
|
High FHbF |
Premature. |
(1,00) |
Fall in p50. |
|
Normal |
|
0,008 |
|
|
Low FHbF |
(Not relevant) |
(0) |
(No effects). |
Definition
FHbF is the fraction of foetal haemoglobin in total haemoglobin.
Reference values
Normal mean values is 0,005.
Normal interval: 0,001 - 0,008.
Newborn infants have higher values, which may be calculated from infant age and estimated days pre- or postmature. The calculation is not yet implemented in the OSA-program.
Measurement
FHbF may be estimated by multiwavelength spectrophotometry on the basis of small differences between the spectrum of adult and foetal haemoglobin.
Effects
The effects of HbF on haemoglobin oxygen affinity (for sO2=0,867) and on the DPG effect are given by:
dlnpO2/dFHbF = -0,25
dlnpO2/d(cDPG/cDPG°) = 0,3 – 0,1 · FHbF
cDPG° = 5 mM
The effect of HbF on p50 is not due to higher Hb-O2 affinity of HbF than HbA. The effect is only observed in the presence of 2,3-diphosphoglycerate and is due to lesser binding of 2,3-DPG to HbF than HbA.
Reference
Wimberley PD. Foetal haemoglobin, 2,3-diphosphoglycerate and oxygen transport in the newborn premature infant. Scand J Clin Lab Invest 1982; 42 Suppl 160:1-149.
Haemoglobin, total concentration
Blood ctHb
Causes and effects of change
|
|
Causes |
Values |
Effects |
|
High ctHb |
High erythropoietin. |
(15) |
High ceHb. |
|
Normal |
|
10,3 |
|
|
Low ctHb |
Haemodilution. |
slight |
Low ceHb.
|
Reference values
Women: 7,56 - 9,24 mM.
Men: 8,46 - 10,34 mM.
Biochemistry
Haemoglobin A (Hb4) is a tetramer consisting of two β chains and two α chains, each containing a haem group (a protoporphyrin ring with a chelated ferro ion) . The molar mass is 64.456 g/mol. Amount of substance of haemoglobin conventionally refers to number of iron atoms and the molar mass employed is MHb = 16 114 g/mol.
The relationship between substance concentration (cHb) and mass concentration (ρHb) is:
ρHb = cHb · MHb.
Measurement
The concentration of total haemoglobin is measured by spectrophotometry.
FCOHb
Causes and effects of change
|
|
Causes |
Values |
Effects |
|
High FCOHb |
Carbon monoxide exposure. |
(0,40) |
Fall in ceHb. |
|
Normal |
|
0,008 |
|
|
Low FCOHb |
(Error of measurement) |
(0) |
(No effects). |
Definition
FCOHb is defined as the fraction of carboxyhaemoglobin in total haemoglobin.
Measurement
FCOHb is measured by multi wavelength spectrophotometry. It is essential that the instrument is carefully calibrated to indicate an FCOHb value of 0,003 using blood from a non smoker.
Effects
Carbon monoxide causes an increase in the haemoglobin oxygen affinity, which is predicted by the Haldane equation.
The effect on p50 is calculated to be dlnp50/dFCOHb = –1,2.
FMetHb
Causes and effects of change
|
|
Causes |
Values |
Effects |
|
High FMetHb. |
Cong. methaemoglobinaemia. |
(0,50) |
Fall in ceHb. |
|
Normal |
|
0,010 |
|
|
Low FMetHb. |
(Error of measurement) |
(0) |
(No effects). |
Definition
FMetHb is defined as the fraction of methaemoglobin in total haemoglobin. Methaemoglobin is also called haemiglobin to indicate that the ferro atom of haemoglobin is oxidized to the ferri form.
Measurement
FMetHb is measured by multiwavelength spectrophotometry.
Effects
Methaemoglobin causes an increase in the haemoglobin oxygen affinity, i.e. a fall in p50:
dlnpO2 / dFMetHb = -0,7, at sO2 = 0,867.
This corresponds to dlnp50 / dFMetHb = -0,8.
Haemoglobin effective concentration
Blood ceHb
Causes and effects of change
|
|
Causes |
Values |
Effects |
|
High ceHb |
High ctHb. |
(15) slight |
Increased cO2Hb and ctO2. Increased px. |
|
Normal |
|
10,2 |
|
|
Low ceHb |
Low ctHb. |
slight |
Decreased px. Low cO2Hb and ctO2. |
Definition
Effective haemoglobin is haemoglobin capable of binding oxygen reversibly at physiological conditions. Dyshaemoglobins are haemoglobins unable to bind oxygen reversibly. Total haemoglobin is the sum of effective haemoglobin and dyshaemoglobin. The most important dyshaemoglobins are carboxyhaemoglobin and methaemoglobin. Other dyshaemoglobins are sulfhaemoglobin and haemoglobin H.
Haemoglobin H is a tetramer of β chains occurring in α-thalassaemia where it may account for more than 20 % of total haemoglobin. It binds oxygen with high affinity with a p50 as low as 0,23 kPa. It shows neither a Bohr pH effect nor haeme-haeme interaction (i.e., Hill slope = 1). These properties deprive HbH of any active role in delivering oxygen to the tissues
Reference values
Women: 7,48 - 9,15 mM.
Men: 8,38 - 10,24 mM.
Calculation
ceHb = ctHb · (1 – FCOHb – FMetHb).
Interpretation
The concentration of effective haemoglobin in blood corresponds to the haemoglobin oxygen (binding) capacity of the blood. When both are expressed as substance concentrations the numerical values are identical. ceHb is one of the important oxygen parameters constituting the oxygen triad: pO2a, p50, ceHb.
Oxygen concentration difference
Arterial - mixed venous blood, DctO2av
(a-v oxygen extraction)
Causes and effects of change
|
|
Causes |
Values |
Effects |
|
High DctO2av |
High O2 consumption rate |
(7) |
Fall in pO2v |
|
Normal |
|
2,8 |
|
|
Low DctO2av |
Low O2 consumption rate |
slight |
Rise in pO2v |
Definition
DctO2av = ctO2a – ctO2v
Reference values
The normal mean value (DctO2avRef) is age and sex dependent and calculated as
DctO2avRef = DctO2av° - Slope · agePt,
DctO2av°(male) = 2,6 mM,
DctO2av°(female) = 2,4 mM,
Slope = 0,004 mM/ a
Carbon Dioxide concentration difference
Mixed venous - arterial blood, DctO2va
Definition
DctCO2va = ctCO2v – ctO2a
Interpretation
The ratio between the veno-arterial total CO2 concentration difference and the arterio-venous total O2 concentration difference is the CO2/O2-exchange ratio, RQ:
RQ = DctCO2va / DctO2av.
APt
The patient surface area is calculated from mPt (patient mass) and hPt (patient height) using the Du Bois Equation.
The surface area is needed to calculate the cardiac index, the oxygen consumption rate relative to body surface area, and the metabolic index.
Causes and effects of change
|
|
Causes |
Values |
Effects |
|
High QA |
High metabolic rate, muscular activity. High ctHb. Low px. |
(10) |
Fall in DctO2av . |
|
Normal |
|
2,8 |
|
|
Low QA |
Low metabolic rate. |
slight |
Increase in DctO2av. |
Definition
Cardiac index(QA) is the cardiac output (Q) divided by body surface area (A). The purpose is to obtain a quantity that is independent of the size of the patient.
Relative cardiac output is the cardiac output relative to the normal mean value for the patient.
Reference values
Reference values for the cardiac index, QA, are: 1,9 - 2,8 L/(min m2).
QARef = WARef/(DctO2avRef · EmO2).
WARef is the normal mean value for the metabolic index and EmO2 is the average molar energy by metabolic reduction of oxygen.
Determination
Cardiac Output (Q) is measured by thermodilution or by Doppler ultrasound.
ńAO2
Causes and effects of change
|
|
Causes |
Values |
Effects |
|
High O2 consumption rate |
Muscular exercise. |
(13,3) slight |
High QA. |
|
Normal |
|
7,1 |
|
|
Low O2 consumption rate |
Hypothyroidism. |
slight |
Low QA. |
Definitions
O2 Consumption Rate: ńO2 = dnO2/dt = DctO2av · Q
O2 Consumption Index: ńAO2 = ńO2/APt.
Relative O2 Consumption Rate: The O2 consumption rate relative to the normal mean value for the patient.
Reference values
O2 Consumption Rate: 11,0 mmol/min (for A=1,9 m2)
O2 Consumption Index: 5,8 mmol/(min m2).
WAO2
Definitions
Energy rate, i.e. the rate of energy production, is called power in physics. The unit of measurement is joule per second: J/s = W (watt).
The power of oxidative metabolism, the energy production rate, is strongly dependent on body size and is therefore generally expressed as the metabolic index, i.e. power relative to body surface area.
Power of Oxidative Metabolism: WO2 = ńO2 · EmO2.
Areic Power of Oxidative Metabolism: WAO2 = WO2/APt
Molar energy of O2 combustion: EmO2 = [450 + 99 · (RQ – 0,82)] kJ/mol
Reference values for WAO2 in W/m2
|
age/a |
0 - 10 |
10 - 25 |
25 - 50 |
50 - |
|
Men |
63-1,2 · a |
51-0,467 · (a-10) |
44-0,08 · (a-25) |
42-0,12 · (a-50) |
|
Women |
63-1,4 · a |
49-0,533 · (a-10) |
41-0,08 · (a-25) |
39-0,12 · (a-50) |
The areic power of oxidative metabolism varies with patient temperature:
dlnWAO2/dT = (ln2)/8 = 0,09
Relative metabolic rate is the power of oxidative metabolism relative to the normal metabolic rate at the actual patient temperature. Therefore the normal mean value is 100 % regardless of patient temperature.
Henderson-Hasselbalch equation
pH- pCO2-temperature coefficients
TANH equation (oxygen dissociation curve)
Haldane equation (carbon monoxide binding)
Du Bois equation (surface area)
The equations are based on quantity algebra and contain quantity symbols only, neither numbers nor units. Values of quantity constants are given outside the equations. Each quantity symbol represents a (variable) number and a unit. The combined units on the two sides of the equal sign must be identical, previously called check of dimensions. Link: mathematical operators, symbols and units.
Henderson Hasselbalch equation
pH = pK + lg (cHCO3ˉ / (αCO2 · pCO2))
pK = 6,1 {at 37 ºC}
αCO2 = 0,230 mM/kPa {at 37 ºC}
The equation is mostly applied to calculation of cHCO3-. Since cHCO3- is virtually independent of temperature it can be calculated from pH and pCO2 values referring to 37 ºC without taking temperature variations of pK and αCO2 into account.
ctH+ = – (1 – (1 – rc) · φEB) · ((cHCO3ˉ – cHCO3º) + bufferval · (pH – pHº))
rc = cHCO3ˉE/cHCO3ˉP = 0,57
φEB = ctHbB/ctHbE (φEB = 'hematocrit')
ctHbE = 21 mM
cHCO3º = 24,5 mM
pHº = 7,40
bufferval = βmHb · ctHb + βP°
βmHb = 2,3
βP° = 7,7 mM
If the albumin concentration (cAlb) is known, the buffer value of non-bicarbonate buffers in plasma may be expressed as a function of cAlb:
βP = βP° + βmAlb · (cAlb - cAlb°)
βmAlb = 8,0
cAlb° = 0,66 mM
ctH+Ecf is calculated using ctHbEcf = ctHbB · FBEcf. FBEcf, volume fraction of blood in extended extracellular fluid, is 0,33 by default. In the newborn a value of 0,25 may be used.
The first term (1 – (1 – rc) · φEB) is an empirical factor which takes the distribution of HCO3ˉ between plasma and erythrocytes into account. The second term (cHCO3ˉ – cHCO3°) titrates the bicarbonate buffer to pH = 7,40 at pCO2 = 5,3 kPa. The last term titrates the non-bicarbonate buffers (primarily Hb and albumin) to pH = 7,40.
The equation was published by the author in his doctoral thesis in 1963. In 1976 the author suggested to name the equation after Donald D. Van Slyke to honour his great contributions to acid-base physiology from 1910 to 1940 and because the author had the fortune to meet Dr. Van Slyke in New York in 1963.
The value for ctH+B refers to the actual haemoglobin oxygen saturation, sO2B. The change in ctH+ with sO2 is called the Haldane effect. The Haldane effect and the Bohr effect are closely related. The value for fully oxygenated haemoglobin ctH+Box may be calculated as:
ctH+Box = ctH+B + B · ceHbB · (1 – sO2),
where B is the Haldane coefficient, defined as B = (¶ctH+/¶cO2Hb)ceHb = (DctH+/DsO2)/ceHb). When applied to whole blood the value is: B = 0,3.
Siggaard-Andersen O. The Van Slyke Equation. Scand J Clin Lab Invest 1977; Suppl 146: 15-20.
Siggaard-Andersen O, Garby L. Editorial: the Bohr effect and the Haldane effect. Scand J Clin Lab Invest 1973; 31: 1-8.
dpH/dT = [dpK/dT – βX · g · (1/ln10)/(cHCO3- + cdCO2)] / [1 + βX · (1/ln10)/(cHCO3- + cdCO2)]
dpK/dT = –0,0026 /K; {carbonic acid pK}
βX = βP + βmHb · ctHb
βP = βP° + βmAlb · (cAlb - cAlb°)
βP° = 7,7 mM
βmAlb = 8,0
cAlb° = 0,66 mM
βmHb = 2,3
g = 0,016 K-1
(Ref. "The Acid-Base Status of the Blood", p. 86, eqn. 10.)
Pure sodium bicarbonate solution
The concentration of dissolved CO2 (cdCO2) remains virtually constant when temperature changes:
cdCO2 = αCO2 · pCO2.
αCO2 is the solubility coefficient of CO2.
dlg(pCO2/p°)/dT = – dlg(αCO2/α°)/dT = A – B · (T – T°).
A = 0,0096 K-1.
B = 0,00018 K-2.
T° = 310,15 K.
α° = 0,230 mM/kPa.
p° = 5,33 kPa.
Plasma and whole blood
dlg(pCO2P/p°)/dT = 0,019.
dlg(pCO2B/p°)/dT = 0,021 (varying with ctHb).
pCO2 as a function of temperature may be calculated from the Henderson-Hasselbalch equation:
dlg(pCO2P/p°)/dT = dpK/dT – dlg(αCO2/α°)/dT – dpH/dT + (dcHCO3-/dT)/(ln10·cHCO3-)
(Ref.: "The Acid-Base Status of the Blood", p 87, eqn. 11.)
To obtain consistent pH and pCO2 temperature coefficients it is preferable to calculate the temperature change in pCO2 on the basis of the pH-temperature coefficient and the condition that the concentration of total carbon dioxide is independent of temperature.
The relationship between pO2 and sO2 is S-shaped in a coordinate system with pO2 on the x-axis and sO2 on the y-axis. A log-logit transformation with log pO2 on the abscissa and log(s/(1-s)) on the ordinate gives a straight line with slope 2,7 over a wide sO2 range but at both ends the slope tapers towards 1. This form can be modelled by a hyperbolic tangent function tilted 45 º by adding y = x.
Haemoglobin binds carbon monoxide as well as oxygen albeit with a much higher affinity. In order to account for this, the model calculates a combined weighted oxygen-carbon monoxide partial pressure (p) for the abscissa and a combined oxygen-carbon monoxide saturation of haemoglobin (s) for the ordinate. These are then transformed logarithmically to x and y, respectively. (xº, yº) is the point of symmetry on the curve.
y – yº = (x – xº) + h · tanh(kº · (x – xº))
y = ln(s/(1 – s))
s = (cO2Hb + cCOHb)/(cO2Hb + cCOHb + cHHb)
s = (sO2 · ceHb/ctHb + FCOHb)/(1 – FMetHb)
yº = ln(sº/(1 – sº))
sº = 0,867
x = ln(p/pº)
p = pO2 + M · pCO
M · pCO from Haldane equation
pº = 7 kPa
h = hº + a
hº = 3,5
kº = 0,5343
xº = a + b
a = a1 + a2 + a3 + a4 + a5
a1 = – 0,88 · (pH - pHº)
pHº = 7.40 (note: pH refers to plasma pH)
a2 = 0,048 · ln(pCO2/ pCO2º)
pCO2º = 5,33 kPa
a3 = – 0,7 · FMetHb
a4 = (0,3 – 0,1 · FHbF)·(cDPG/cDPGº – 1)
cDPGº = 5,00 mM
a5 = –0,25 · FHbF
The Bohr coefficient is defined as b = – dlgpO2/dpH.
The value is lower for whole blood than for a haemoglobin solution, e.g. erythrocyte fluid:
dlgpO2/dpHP = (dlgpO2/dpHE) · (dpHE/dpHP), where (dpHE/dpHP) = 0,77.
The value decreases with increasing sO2. For sO2 = 0,5, the value is 0,50 for whole blood..
According to equation a1 = – 0,88 · (pH - pHº), – dlnpO2/dpH = 0,88 at sO2 = 0,867;
hence: – dlgpO2/dpH = 0,88/ln10 = 0,38.
b = (∂ lnpO2/∂ T)sO2 = 0,055 /K
Siggaard-Andersen O, Wimberley PD, Gøthgen IH, Siggaard-Andersen M. A mathematical model of the haemoglobin-oxygen dissociation curve of human blood and of the oxygen partial pressure as a function of temperature. Clin Chem 1984; 30: 1646-51.
pO2/cO2Hb = M · pCO/cCOHb
M = 218 (Haldane factor)
pCO : tension of carbon monoxide
cO2Hb = sO2 · ceHb
cCOHb = FCOHb · ctHb
ctO2 = sO2 · ceHb + pO2 · αO2
αO2 : solubility coefficient of oxygen in blood
αO2= exp( ln(αO2(37)) – (dln(αO2)/dT) · (T – Tº) + 2 · (d2ln(αO2)/dT) · (T – Tº)2 )
Tº = 37 ºC
aO2 (37) = 0,0105 mM/kPa
dln(αO2)/dT = 0,0115 /K
d2ln(αO2)/dT = 0,000105 /K
pO2A = pO2hI – pCO2A · (RQ-1 – FO2dI · (RQ-1 – 1))
RQ = DctCO2va / DctO2av
If RQ = 1 or FO2dI = 1 then pO2A = pO2hI - pCO2A.
pCO2A is often taken to be equal to pCO2a but is actually slightly lower due to physiological v-a shunting. It may be calculated approximately from the arterial and venous pCO2 and the estimated shunt fraction (Fva) by using the equation:
pCO2A = (pCO2a – Fva · pCO2v)/(1 – Fva)
If pCO2v is unknown, a default value is used, calculated as:
pCO2v = pCO2a + DpCO2std · (1-Fva) kPa.
DpCO2std = 0.6 kPa (the normal veno-arterial pCO2 difference)
When Fva is low (<0.1), pCO2A approximately equals pCO2a.
Fva = (ctO2A – ctO2a)/(ctO2A – ctO2v)
A:
here refers to blood in equilibrium with ideal alveolar air;
a: refers to the systemic arterial blood;
v: refers to mixed venous blood from the pulmonary artery.
If mixed venous blood is not available a default value for ctO2v is calculated:
ctO2v = ctO2a – DctO2avStd
DctO2avStd = 2,3 mM.
pO2 of the blood varies with temperature for two reasons:
1. The solubility coefficient for oxygen, αO2, varies with temperature as given in the Total Oxygen Equation.
2. The haemoglobin-oxygen affinity varies with temperature as expressed by the parameter b of the TANH Equation.
Conversion of pO2(37) to pO2 at TPt is based on the condition that ctO2B is constant:
1. Calculate ctO2 at 37 ºC from pO2(37) using the combined Total Oxygen and TANH Equations.
2. Calculate pO2 from ctO2 at TPt (which equals ctO2 at 37 ºC) using the combined Total Oxygen and TANH Equations with parameters referring to TPt.
Body surface area (APt) is a function of body mass (mPt) and height (hPt):
lg (APt/A°) = fm · lg (mPt/m°) + fh · lg (hPt/h°)
fm = 0,425 (empiric constant)
fh = 0,725 (empiric constant)
A° = 1,90 m2
m° = 70 kg
h° = 1,82 m
Names of quantities may be expressed by any of the following schemes:
Physical system - component - property, e.g. plasma oxygen tension.
Component - property in physical system, e.g. oxygen tension in plasma.
Property of component in physical system, e.g. tension of oxygen in plasma
Symbols of quantities are based on the latter scheme:
pO2Alv: partial pressure of oxygen in alveolar air.
ctCO2P: concentration of total carbon dioxide in plasma.
cDPGEry: concentration of 2,3-diphosphoglycerate in erythrocytes.
sO2Hb: saturation fraction of oxygen in haemoglobin.
Some properties do not refer to a component in the system but to the whole system, e.g. mass of patient (mPt).
Quantities expressing change with time need specification of the cause of change (the process):
volume rate of blood circulation in patient (also called cardiac output),
substance rate of oxygen consumption in patient,
substance rate of oxygen flow in aorta (also called oxygen delivery),
energy rate by oxidative metabolism in patient (energy rate is also called power).
Symbols indicating the property are italicized:
c (substance) concentration mM (mmol/L)
P (total) pressure kPa
p partial pressure (gas phase) kPa
p tension (solution) kPa
F substance fraction 1 (mol/mol)
s saturation fraction 1 (mol/mol)
Generally an operator operates on the subsequent product (or quotient, power, or root, all special cases of products); the action ends at the first addend or subtrahend (negative addend).
Operators are always printed upright, variables are printed italic.
The multiplication sign (·) should never be omitted except between number and unit.
|
Symbol |
Name |
Explanation |
|
antilg x |
antilogarithm |
10x |
|
d |
differential |
dx = δx for δx → 0 |
|
|
dln x = (1/x)·dx |
|
|
|
|
dex = ex ·dx |
|
|
|
dxn = n · xn-1 · dx |
|
|
|
d(x · y) = x·dy + y·dx |
|
|
|
dz = (∂ z/∂ xi)x¹xi · dxi |
|
|
|
d tanh x = (1 – tanh2x) · dx |
|
exp x |
exponent |
ex |
|
lb |
binary logarithm |
log2 |
|
lg |
decimal logarithm |
log10 |
|
ln |
natural logarithm |
loge |
|
log |
logarithm |
unspecified base number |
|
logit x |
logit |
log(x/(1-x)) |
|
p |
negative logarithm |
px = -lg x |
|
tanh x |
hyperbolic tangent |
(ex – e-x)/(ex + e-x) |
|
∆ or D |
difference |
∆x12 = x1 – x2 |
|
δ |
increment |
δx = arbitrary increment of x |
|
∂ |
partial differential |
∂ z/∂ xi = dz/dxi for constant x ≠ xi |
|
∏ |
product |
∏i xi = x1 · x2 · x3 ··· xi ··· xn |
|
/ |
solidus |
a/b·c = a/(b·c) |
|
|
|
a/b±c = (a/b)±c |
|
|
|
a/b/c = a/(b/c) = a·c/b |
Extensive and Intensive Chemical Quantities
The acid-base status is a description of two components: hydrogen ion (H+) and carbon dioxide (CO2). Any component in a solution can be described by two quantities: (1) the total amount of component added to the system, expressed as the concentration of total component, and (2) the activity of the component in the system, often expressed as the concentration of free component. Examples of these quantities are: concentration of total calcium and concentration of free calcium ion (“ionized calcium”) , concentration of total magnesium and of free magnesium ion (“ionized magnesium”), concentration of total thyroxin and of free thyroxin, concentration of total oxygen and concentration of free dissolved oxygen (usually expressed as the oxygen tension), concentration of total carbon dioxide and concentration of free dissolved carbon dioxide (usually expressed as the carbon dioxide tension). In the case of hydrogen ions the analogy is the concentration of total (titratable) hydrogen ion (often expressed with opposite sign as concentration of titratable base or base excess) and the concentration of free hydrogen ion (usually expressed as the negative logarithm, i.e. pH). Unfortunately, the term base excess is not readily interpreted as a hydrogen ion deficit. Often it is still considered an indication of an excess of strong cation. In the case of carbon dioxide the pCO2 is the independent variable. In the case of hydrogen ion the excess or deficit of titratable hydrogen ion is the independent variable.
The amount of substance of component added or removed in the process of formation of a system is sometimes called the stoichiometric amount of substance of the component in the system, symbol no. Specifying the stoichiometric amount of the components in a system is a prescription for the system, e.g. noH2O = 55,6 mol, noNaHCO3 = 25 mol, noHCl = 10 mol, noCO2 = -10 mol. Result: an aqueous solution with cNa+ = 25 mM, cHCO3¯ = 15 mM, cCl¯ = 10 mM. Notice that the stoichiometric amount may be negative.
Stoichiometric amount of substance of a component (B) in a system is usually expressed per unit volume (V) of the system, as the stoichiometric concentration (co):
coB = noB/V.
The component added to the system may dissociate or react with other components to form a series of derived components and only a fraction of the original component may actually exist in a free form in the system. It is therefore essential to distinguish between the stoichiometric concentration (coB) and the substance concentration of the free form of the component (cB).
In clinical chemistry, the term stoichiometric concentration is rarely employed. Instead, the names total, titratable, added, or excess concentration is employed or these adjectives are attached to the component (ctB).
In the case of carbon dioxide and oxygen the extensive quantities are the concentrations of total carbon dioxide and total oxygen, respectively, or more specifically the amounts released when the pCO2 and pO2 are reduced to zero.
In the case of hydrogen ion in aqueous solution the extensive quantity cannot be defined as the concentration of total hydrogen ion, i.e. the amount removed when the hydrogen ion activity is reduced to zero. We need to define added or removed hydrogen ion in relation to a reference state of the system with a reference pH value. This is called titratable hydrogen ion. Furthermore, since hydrogen ions cannot be added or removed without an accompanying anion or exchanging cation (law or electric neutrality), we need to specify that hydrogen ions are accompanied by an indifferent anion (e.g. chloride).
The chemical potential of a component in a system is the intensive chemical quantity. Stoichiometric amount of substance and chemical potential are analogous to the spatial quantities: volume and pressure; the thermal quantities: entropy and temperature; the electrical quantities: electric charge and electric potential. The products of extensive and intensive quantities all represent energy: chemical energy, spatial energy, thermal energy (heat) and electrical energy, respectively.
Chemical potential is defined as the differential change in internal energy of the system (U) divided by the differential change in added amount of substance, maintaining other independent extensive variables constant, i.e. volume (V), entropy (S), electric charge (Q), and stoichiometric amount of other components (C,D, etc.):
μB = (∂ U/∂ noB)V,S,Q,noC,…
The chemical potential is converted to the absolute chemical activity (λ);
λB = exp(μB/R·T)
The ratio between the absolute chemical activity and the molality of free component (mB) is expressed by the molal activity coefficient (γB):
γB = (λB/mB)/lim(λB/mB)∞
The superscript ∞ indicates infinite dilution.
Molal activity is defined as:
maB = γB · mB
Molal activity and activity coefficient are both measurable quantities, hence the molality of free component may be derived as:
mB = maB/γB
Substance concentration (c) is obtained by multiplying molality with the mass concentration of water (ρH2O):
cB = mB · ρH2O
Concentrational activity may be defined in analogy with molal activity. The relationship between the two is:
caB = maB · ρH2O*
where ρH2O* is mass concentration of pure water (= 0,993 kg/L at 37 °C).
In clinical chemistry it is general practice to report concentration of the (free) component rather than the chemical activity. Exceptions are the intensive quantities related to hydrogen ion, carbon dioxide, and oxygen. Hydrogen ion activity is expressed in terms of pH. The activities of carbon dioxide and oxygen in the blood are expressed in terms of the gas tensions.
pH and the concentration of hydrogen ions
pH is defined as the negative decadic logarithm of the molal activity of hydrogen ions:
pH = – lg (maH+/ maH+°) = – (μH+ – μH+°)/(ln10·R·T)
maH+° = 1 mol/kg.
The definition is traditionally based on molality rather than substance concentration.
pH is linearly related to the chemical potential of hydrogen ion (μH+).
Chemical potential or activity of ions cannot be determined on purely thermodynamical basis. This is due to the fact that the effects of an ion cannot be separated from the effects of the accompanying counter ion, or in other terms, the electro-chemical potential of the ion cannot be separated into the chemical and the electrical component. Such a separation must necessarily be based on a non-thermodynamic convention.
The present convention is based on the assumption that the molal activity coefficient of the chloride ion in dilute aqueous solutions (ionic strength < 0,10 mol/kg) can be estimated by means of the Debye-Hückel equation:
– lg γB = (A · z2B · I½)/(1 + å · B · I½),
I is ionic strength, z is charge number, A and B are temperature dependent constants. According to the Bates-Guggenheim convention, å · B is taken to be 1,5 (mol/kg)–½ at all temperatures and for all compositions of the solution. A = 0,5215 (mol/kg)–½ , B = 3,305 (mol/kg)–½/nm, at 37 °C.
The definitive method for pH measurement in dilute aqueous solutions is based on the hydrogen electrode, measuring the electromotive force of a cell without a liquid-liquid junction (without transference), E:
Ag (s) | AgCl (s) | buffer solution with added NaCl | H2, pH2 = 101,325 kPa | Pt (s)
The calculation function is:
pH = – (E – E°) / (R·T·ln10/F) + lg (mCl-/mCl°) + lg γCl¯,
where E° is the potential of the cell with a standard HCl solution with maHCl = 1 mol/kg. With opposite sign E° is the standard electrode potential of the Ag|AgCl half cell (0,21423 V at 37 °C).
The reference method for blood pH is based on a glass pH electrode in a cell with a liquid-liquid junction, measuring the cell potential with the blood, EB, and the calibration solution ES:
Reference electrode | KCl solution (m > 3,5 mol/kg) :: Blood or calibrator | | Inner ref. soln. | Inner ref. electrode
The reference electrode may be an Hg | HgCl2 electrode or an Ag | AgCl electrode. The liquid-liquid junction is symbolized by ::, the glass membrane by ||.
The inner reference solution may be a phosphate buffer with added NaCl. The inner reference electrode is usually an Ag | AgCl electrode.
The calculation function is:
pHB = pHS – (EB – ES)/(R·T·ln10/F).
This equation is generally called the ‘operational’ pH definition.
The reference method is subject to a small variable bias due to differences between the liquid junction potential for the calibration solution and the unknown solution. A greater bias may arise if the bridge solution is not a concentrated solution of KCl or CsCl.
With whole blood, the concentrated bridge solution causes a crenation of the erythrocytes with formation of a layer of diluted plasma at the junction. As a result the pH measured in whole blood is slightly lower than the pH measured in the corresponding plasma. The difference amounts to about 0,01 with a normal haematocrit, increasing to about 0,04 when the haematocrit is 0,75. Usually the blood pH is not corrected for this bias.
Hydrogen ions are hydrated in aqueous solutions and mostly occur as H3O+.
Partial pressure, fugacity, and tension of gases
Partial pressure (p) of a component (B) in a gas mixture is defined as the substance fraction (x) of the component times the pressure of the gas mixture (P):
pB = xB · P
Partial pressure strictly speaking only applies to a component in a gas mixture. When applied to gases in liquid solution it should be called the gas tension. It may be interpreted as being equal to the partial pressure in an ideal gas mixture in equilibrium with the solution, or as being equal to the fugacity (f) in a real gas mixture in equilibrium with the solution. Fugacity of a component in a gas mixture is defined as the fugacity coefficient (g) for the component times the partial pressure:
fB = gB · pB
Since the fugacity coefficient is dimensionless, the unit of fugacity is the same as the unit of pressure. For many gases (CO2, O2, N2, etc.) g ≈ 1 when P < 100 kPa.
The tension of a gas in a solution is directly proportional to the rational chemical activity (ax) of the solute. This relationship is called Henry's law:
pB = axB / αx∞B
αx∞B is the rational solubility coefficient for infinite dilution, i.e. for pure solvent.
The substance concentration of a gas in a solution can be derived from the gas tension by multiplication with the concentrational solubility coefficient (αc):
cB = αcB · pB
Reference
Siggaard-Andersen O, Durst RA, Maas AHJ. Approved recommendation (1984) on physico-chemical quantities and units in clinical chemistry, with special emphasis on activities and activity coefficients. Approved by International Union of Pure and Applied Chemistry and by International Federation of Clinical Chemistry. J Clin Chem Clin Biochem 1987; 25: 369 - 91.
End of Textbook.